
January 2026 | Monthly market recap
U.S. stock market notched ninth consecutive month of gains
Stocks turned in another month of gains in January, their ninth in a row, with the S&P up more than 1%. This was an unusually strong January for stocks, which over the past 20 years has been a month of generally lackluster returns. But it would be premature to call the gains a good omen: 2026 is a midterm election year, which has historically proven challenging for equities.
ONE-MONTH PERFORMANCE as of 1/31/2026 | ||||
|---|---|---|---|---|
U.S. large caps (S&P 500) | U.S. small caps (Russell 2000) | International developed (MSCI EAFE) | Emerging markets (MSCI EM) | Investment-grade bonds (Bloomberg Agg) |
1.45% | 5.35% | 5.22% | 8.85% | 0.11% |
Source: Boston Partners; all data via individual index providers. Past performance does not guarantee future results. See below for definitions.
Value stocks once again outperformed across the board
It’s beginning to look a lot like a rotation: Value stocks across all three major capitalization ranges—large, mid, and small—beat their growth counterparts again in January. The discrepancy was most pronounced among larger names, with large-cap growth stocks finishing in negative territory for the month. In fact, since November 21—which marked the low point in a drawdown that lasted a little over three weeks—value stocks have significantly outperformed both the S&P 500 and the Magnificent Seven. See our chart of the month for more.
KEY ECONOMIC INDICATORS | |||||
|---|---|---|---|---|---|
GDP (Q3 vs. Q2) | Fed funds rate | 10-year UST | Inflation (CPI) | Jobs | |
Most recent | 4.4% | Unchanged | 4.26% | 2.7% | 50,000 |
Prior reading | 3.8% | 3.75%–4.00% | 4.18% | 2.7% | 56,000 |
Sources: Gross domestic product (GDP) via the U.S. Bureau of Economic Analysis. Federal funds rate via the Federal Reserve Bank of St. Louis (FRED). 10-year U.S. Treasury (UST) rates via the U.S. Department of the Treasury. Inflation (CPI) and jobs (non-farm payroll figures) via the U.S. Bureau of Labor Statistics. All “most recent” data is for the month of January and is compared with the month prior, except CPI and jobs figures, which reflect December data—the most recent available. Note that GDP data is compared with the prior quarter.
International stocks posted solid gains across multiple segments
Developed- and emerging-market stocks both posted solid gains again in January, with the latter segment approaching double-digit returns. U.S. investors continued to search for more attractive areas to allocate capital, and the overseas trade benefits from relatively compelling valuations and a steady macroeconomic backdrop. The U.S. dollar began the month on an upward trajectory before abruptly reversing course at the halfway mark and ultimately finished lower; the weaker dollar served as a tailwind for domestic investors in international foreign-denominated securities.
Federal Reserve hit the pause button
Last year ended with three consecutive rate cuts from the Federal Reserve, but the board is now officially on hold after voting to keep short-term rates steady in their January meeting. President Trump has made clear his preference for lower rates (despite an inflation level that remains above the Fed’s stated target), and whoever becomes the new chair in May will face increased pressure to deliver on that front. That said, there’s little economic evidence to suggest monetary policy is restrictive at today’s rates, so what it would take for a divided Fed to rally around the idea of materially lower interest rates remains to be seen.
Bond markets posted slight gains despite uptick in longer-term rates
Intermediate-term, investment-grade bonds were up slightly in January, despite marginally higher rates across the yield curve; the slight price declines were offset by interest income to push the Agg into the black for the month. Overall the yield curve remains relatively flat, with the spread between 2- and 10-year maturities finishing at 74 basis points, roughly half what they were five years ago.
Upcoming key events
- February 4: Alphabet reports earnings
- February 5: Amazon reports earnings
- February 11: CPI data for January released
- February 25: Nvidia reports earnings
Chart of the month
After a sharp pullback in large, U.S. technology stocks in late November, it may feel like things have returned to normal. But the data tell a different story, with small-company, international, and value stocks gaining favor among investors.
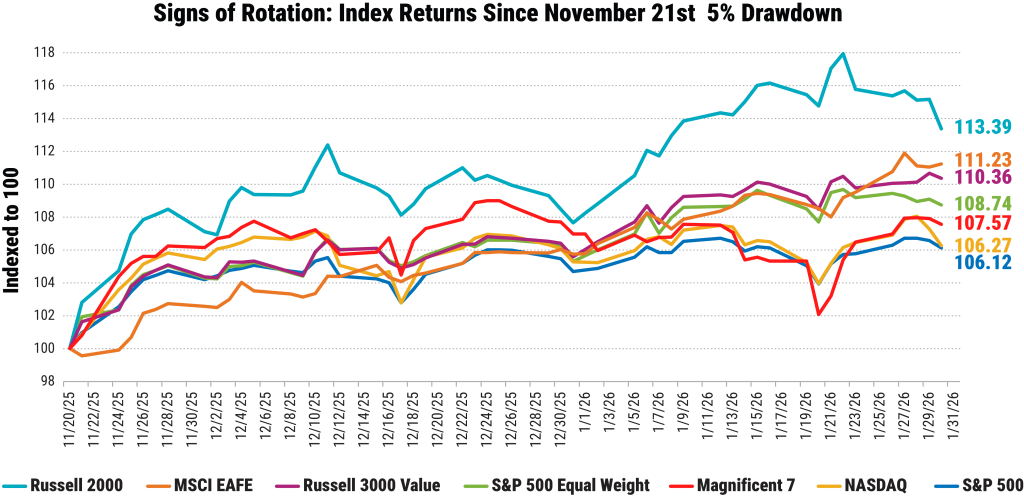
Source: Bloomberg, as of January 23, 2026. The S&P 500 Index is a capitalization-weighted index, meaning that larger companies represent a proportionally larger share of the index. The S&P 500 Equal Weight Index weights each company in the index equally. Past performance does not guarantee future results. You cannot invest directly in an index. See below for additional index definitions.
To learn more, contact us at [email protected].
Important information
Boston Partners Global Investors, Inc. (“Boston Partners”) is an Investment Adviser registered with the Securities and Exchange Commission under the Investment Advisers Act of 1940. Registration does not imply a certain level of skill or training. Boston Partners Global Investors, Inc. (Boston Partners) is composed of three divisions, Boston Partners, Boston Partners Private Wealth, and Weiss, Peck & Greer (WPG) Partners, and is an indirect, wholly owned subsidiary of ORIX Corporation of Japan (ORIX).
The views and opinions expressed may change based on market and other conditions. This material is provided for informational purposes only and should not be construed as investment advice. There can be no assurance that developments will transpire as forecasted. Actual results may vary. No investment strategy or risk management technique can guarantee return or eliminate risk in all market environments.
The Bloomberg U.S. Aggregate Bond Index tracks the performance of intermediate-term investment-grade bonds traded in the United States. The Consumer Price Index is a commonly used measure of inflation that tracks the variation in prices paid by typical consumers for retail goods and other items. The Magnificent Seven stocks are a group of high-performing and influential companies in the U.S. stock market: Alphabet, Amazon, Apple, Meta Platforms, Microsoft, Nvidia, and Tesla. The MSCI EAFE Index tracks the performance of large- and mid-cap equities traded across global developed markets, excluding the United States and Canada. The MSCI Emerging Markets Index tracks the performance of large- and mid-cap equities traded in global emerging markets. The NASDAQ 100 tracks the performance of the 100 largest non-financial companies listed on the Nasdaq stock exchange. The Russell 1000 Growth and Value Indexes track the performance of those large-cap U.S. equities in the Russell 1000 Index with growth and value style characteristics, respectively. The Russell 2000 Index tracks the performance of the 2,000 smallest companies traded in the United States. The S&P 100 and 500 Indexes track the performance of the 100 and 500 largest companies traded in the United States, respectively. S&P 500 Equal Weight Index also tracks the performance of the 500 largest companies traded in the United States, but weights each company equally, rather than proportionally according to market cap. It is not possible to invest directly in an index. Russell 3000® Index: The Russell 3000® Index measures performance of the 3,000 largest U.S. companies based on total market capitalization. The Russell 3000® Index measures performance of the 3,000 largest U.S. companies based on total market capitalization. Russell 3000® Value Index: The Russell 3000® Index measures performance of the 3,000 largest U.S. companies based on total market capitalization. The Russell 3000® Value Index contains stocks included in the Russell 3000® Index displaying low price-to-book ratios and low forecasted growth values.
The breakpoints for capitalization ranges should be viewed only as guideposts and will change over time. In general, FTSE Russell (which maintains a number of stock-market indexes based on company size) considers small-cap stocks to have market caps of between $150 million and $7 billion, mid caps to have market caps between $7 billion and $150 billion, and large caps to be those companies with market caps above $150 billion.
8037497.11