
June 2026 | Monthly market recap
A landmark ceasefire, a historic IPO, and a new Fed chair defined an eventful June
U.S. equities were volatile in June, with large caps finishing somewhat lower for the month. The United States and Iran agreed to terms to end their war and reopen the Strait of Hormuz—a major breakthrough that brought immediate relief to global markets. President Trump announced the deal on June 15, with the Strait formally set to reopen shortly thereafter, and a memorandum of understanding scheduled to be signed in Switzerland. The effect on energy markets was swift and substantial, with crude oil prices falling sharply as the Hormuz shipping lanes reopened.
The shift in the macro backdrop reshuffled sector leadership dramatically: Industrials emerged as the month’s clear leader, supported by broad-based capital spending in electricity capacity, artificial intelligence (AI) infrastructure construction, and defense, while Healthcare and Financials also advanced solidly. Information Technology, meanwhile, finished roughly flat, and Communication Services was the month’s notable laggard, as scrutiny of AI capital spending weighed on several of the sector’s largest constituents.
ONE-MONTH PERFORMANCE as of 06/30/2026 | ||||
|---|---|---|---|---|
U.S. large caps (S&P 500) | U.S. small caps (Russell 2000) | International developed (MSCI EAFE) | Emerging markets (MSCI EM) | Investment-grade bonds (Bloomberg Agg) |
–0.95% | 3.74% | 0.09% | –1.41% | 0.24% |
Source: Boston Partners; all data via individual index providers. Past performance does not guarantee future results. Short-term performance may not reflect broader market trends and may not be indicative of future results. See below for definitions.
The AI trade bifurcated in June as SpaceX debuted and Microsoft stumbled
June marked the opening act of what may be the most consequential wave of technology IPOs since the Dot-Com Era. SpaceX debuted on June 12 with a valuation of roughly $1.75 trillion—what has been widely reported as the largest initial public offering in history—with Anthropic targeting an October listing, and OpenAI pursuing a similar timeline. Even as the IPO pipeline captured headlines, the more consequential June equity story may have been the growing divergence within the AI trade itself. Microsoft’s stock fell roughly 20% in June, as markets reacted to concerns about its future growth trajectory. The central issue is whether demand for cloud and AI products can realistically offset the rising costs of building and operating AI infrastructure—a concern that also weighed on Oracle and Alphabet during the month. The contrast was stark: Hardware and semiconductor names tied to AI infrastructure continued to perform well, while the large-cap software and cloud players bearing the cost of that buildout faced meaningful multiple compression. The market, it seems, is beginning to separate AI’s winners from those that will bear its costs.
KEY ECONOMIC INDICATORS | |||||
|---|---|---|---|---|---|
GDP (Q2 vs. Q1) | Fed funds rate | 10-year UST | Inflation (CPI) | Jobs | |
Most recent | 2.1% | Unchanged | 4.44% | 4.2% | 57,000 |
Prior reading | 0.5% | 3.50%–3.75% | 4.45% | 3.8% | 172,000 |
Sources: Gross domestic product (GDP) via the U.S. Bureau of Economic Analysis. Federal funds rate via the Federal Reserve Bank of St. Louis (FRED). 10-year U.S. Treasury (UST) rates via the U.S. Department of the Treasury. Inflation (CPI) and jobs (non-farm payroll figures) via the U.S. Bureau of Labor Statistics. All “most recent” data is for the month of June and is compared with the month prior, except CPI, which reflects May data—the most recent available. Note that GDP data is compared with the prior quarter.
International markets diverged in June, with Europe gaining and Asia sending mixed signals
International equity markets told a tale of regional divergence in June. European stocks, which had been more subdued in recent months as higher oil prices weighed disproportionately on the region’s energy-importing economies, found relief after the Iran ceasefire. In Asia, the picture was sharply divided. Taiwan edged higher on the month, recovering from a steep mid-month selloff, while South Korea experienced meaningful volatility: the country’s stock market experienced a plunge in early June, triggered by a combination of a Broadcom earnings guidance disappointment and a meaningful selloff in heavyweight chipmakers Samsung Electronics and SK Hynix. Meanwhile, the U.S. dollar strengthened meaningfully during the month, driven in part by the Federal Reserve’s hawkish pivot, which served as an additional headwind for domestic investors holding foreign currency-denominated securities.
Warsh's first FOMC meeting signaled a hawkish turn and a leaner Fed communication style
Kevin Warsh’s first meeting as Federal Reserve chairman concluded on June 17 with no change in interest rates: The Federal Open Market Committee (FOMC) voted unanimously to keep its benchmark overnight borrowing rate anchored in a range of 3.5%–3.75%. But the meeting differed markedly from its predecessors in almost every other respect. The Fed’s post-meeting statement was dramatically shortened to just 130 words (compared with nearly 350 words for the prior April release) and removed key language indicating a bias toward future rate cuts. The updated Dot Plot—which notably excluded Warsh’s own projection, as he declined to submit a forecast—showed a median funds rate of 3.8% by year end, up from 3.4% in March. Officials also raised their 2026 headline inflation forecast to 3.6%, with Warsh stating that the commitment to deliver price stability is “strong, unanimous, and unambiguous.” Markets now anticipate a potential hike as early as September, pricing in a roughly 40% chance as of July 2, per CME Group.
Bond yields remained elevated as the prospect of higher policy rates loomed
The U.S. bond market navigated a volatile month, shaped heavily by the June FOMC meeting and its hawkish undertones. Entering the month, the 2-year Treasury yield stood at 3.98% and the 10-year at 4.45%. By the end of June, the 10-year had barely budged, finishing at 4.44%, while the 2-year had climbed to 4.14%—a divergence that reflected the market’s repricing of near-term Fed policy risk. The unambiguous end of a potential Fed easing bias, combined with an upward revision to the inflation forecast and the signal that a rate hike remains on the table, kept upward pressure on the shorter end of the yield curve. With the Fed now clearly prioritizing price stability over growth support, the bond market appeared to be adjusting to a higher-for-longer rate environment.
Upcoming key events
- July 2: Monthly Employment Report (June jobs data) released
- July 14: CPI data for June released; Bank of America, Citigroup, Goldman Sachs, JPMorgan, Wells Fargo report earnings
- July 22-30: Alphabet, Amazon, Apple, Meta, Microsoft, Tesla report earnings
- July 30: Q2 2026 GDP estimate released
Chart of the month
It’s been a wild ride for oil prices this year. After jumping roughly 50% as the United States and Israel began military operations against Iran, oil is now back nearly where it started, having fallen precipitously in June after the U.S. and Iran signed a memorandum of understanding (MOU) instituting a ceasefire—for now. Energy stocks pulled back somewhat on the news, while European equites, which had suffered acutely from the higher energy prices, trended higher. The next chapter for oil, and for any number of global economies, will depend on whether the Strait of Hormuz continues to reopen—and stays open.
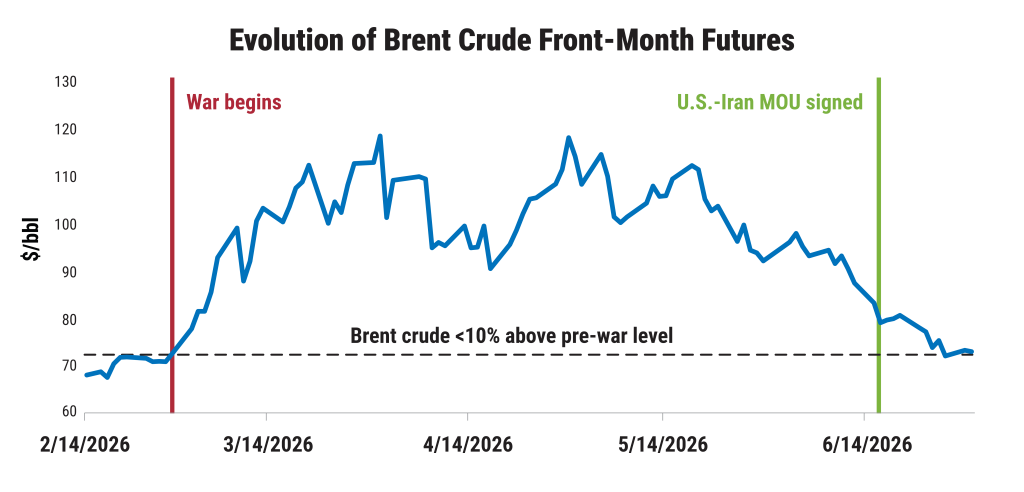
Source: FRED, Federal Reserve Bank of St. Louis, as of July 1, 2026. Past performance does not guarantee future results. You cannot invest directly in an index. See below for additional definitions. The chart shows the start date of the war in Iran as February 28, 2026, at which point oil prices were roughly $71 per barrel; by March 17, prices were over $108, representing a more than 50% increase.
To learn more, contact us at [email protected].
Important information
Boston Partners Global Investors, Inc. (“Boston Partners”) is an investment adviser composed of two divisions, Boston Partners and Weiss, Peck & Greer Partners (“WPG”), and is an indirect, wholly owned subsidiary of ORIX Corporation of Japan (“Orix”). Boston Partners is affiliated with listed corporations through common ownership. ORIX Corporation Europe, N.V. services may be offered in the U.S. through Robeco Institutional Asset Management, U.S.
The views and opinions expressed may change based on market and other conditions. This material is provided for informational purposes only and should not be construed as investment advice. There can be no assurance that developments will transpire as forecasted. Actual results may vary. No investment strategy or risk management technique can guarantee return or eliminate risk in all market environments. Forward-looking statements and opinions are based on current market conditions and are subject to change without notice. Actual events or results may differ materially from those discussed.
The Bloomberg U.S. Aggregate Bond Index tracks the performance of intermediate-term investment-grade bonds traded in the United States. The Consumer Price Index is a commonly used measure of inflation that tracks the variation in prices paid by typical consumers for retail goods and other items. The MSCI EAFE Index tracks the performance of large- and mid-cap equities traded across global developed markets, excluding the United States and Canada. The MSCI Emerging Markets Index tracks the performance of large- and mid-cap equities traded in global emerging markets. The NASDAQ 100 tracks the performance of the 100 largest non-financial companies listed on the Nasdaq stock exchange. The Russell 1000 Growth and Value Indexes track the performance of those large-cap U.S. equities in the Russell 1000 Index with growth and value style characteristics, respectively. The Russell 2000 Index tracks the performance of the 2,000 smallest companies traded in the United States. The S&P 100 and 500 Indexes track the performance of the 100 and 500 largest companies traded in the United States, respectively. S&P 500 Equal Weight Index also tracks the performance of the 500 largest companies traded in the United States, but weights each company equally, rather than proportionally according to market cap. It is not possible to invest directly in an index.
A front month futures contract has the shortest time to expiration, making it the most liquid and actively traded contract in the market. The futures market allows participants to buy and sell standardized contracts that set the price of a commodity or financial instrument for delivery at a future date. Futures prices reflect current market expectations based on available information, including supply and demand conditions, interest rates, and economic or geopolitical developments. Because these factors can change quickly, futures prices may be volatile and can rise or fall significantly over short periods of time.
The breakpoints for capitalization ranges should be viewed only as guideposts and will change over time. In general, FTSE Russell (which maintains a number of stock-market indexes based on company size) considers small-cap stocks to have market caps of between $150 million and $7 billion, mid caps to have market caps between $7 billion and $150 billion, and large caps to be those companies with market caps above $150 billion.
8037497.17