
July 2026 | Monthly market recap
S&P 500 slipped in July, its second consecutive monthly decline
The S&P 500 was down only slightly in July, but that muted performance masked some significant action under the surface throughout the month. The index fell as much as 2.4% mid-month amid an artificial intelligence (AI) trade pullback as investors worried that capital expenditures might grow at a slower pace and that competition from open-source models could threaten AI business models. The resulting unwind of some highly leveraged positions in the AI trade further exacerbated the selloff. Conversely, strong performance from hyperscalers Amazon and Microsoft after late-month earnings releases—which showed evidence of attractive returns on AI investments—softened index-level losses. On the geopolitical front, the Iran war re-escalation drove Brent crude higher, up to just over $90 per barrel, which in turn helped push yields on 10-year Treasuries up to a year-to-date high of 4.75%. Against this backdrop, value stocks again outperformed their growth counterparts; outperformance in sectors like Energy (up more than 12%) and Financials (up more than 6%, helped by strong bank earnings) were meaningful contributors.
ONE-MONTH PERFORMANCE as of 07/31/2026 | ||||
|---|---|---|---|---|
U.S. large caps (S&P 500) | U.S. small caps (Russell 2000) | International developed (MSCI EAFE) | Emerging markets (MSCI EM) | Investment-grade bonds (Bloomberg Agg) |
–0.06% | 3.03% | 1.97% | –3.07% | –1.30% |
Source: Boston Partners; all data via individual index providers. Past performance does not guarantee future results. See below for definitions.
Value dominated growth as market leadership rotated
Value’s dominance over growth continued in July. Year-to-date, the Russell 1000 Value Index has now outperformed the Russell 1000 Growth Index by more than 20%, with July extending that trend. While Energy and Financials turned in the strongest showing across sectors, there were also gains across almost all other sectors. Even Information Technology performed well within value despite the AI selloff; Russell index reconstitution resulted in a higher weighting certain tech stocks including Microsoft—which had a strong month on good earnings—and that benefitted the sector.
KEY ECONOMIC INDICATORS | |||||
|---|---|---|---|---|---|
GDP (Q2 vs. Q1) | Fed funds rate | 10-year UST | Inflation (CPI) | Jobs | |
Most recent | 1.5% | Unchanged | 4.75% | 3.5% | 57,000 |
Prior reading | 2.1% | 3.50%–3.75% | 4.44% | 4.2% | 172,000 |
Sources: Gross domestic product (GDP) via the U.S. Bureau of Economic Analysis. Federal funds rate via the Federal Reserve Bank of St. Louis (FRED). 10-year U.S. Treasury (UST) rates via the U.S. Department of the Treasury. Inflation (CPI) and jobs (non-farm payroll figures) via the U.S. Bureau of Labor Statistics. All “most recent” data is for the month of June and is compared with the month prior. Note that GDP data is compared with the prior quarter.
International markets diverged on AI and energy exposure
Non-U.S. equity performance was mixed during July, but the standout story was the dramatic reversal in South Korea. The KOSPI (the South Korean stock market index) collapsed by more than 20% during the month, reflecting a sharp and sudden reassessment of AI chip demand sustainability; when cracks appeared in that narrative, foreign investors and institutions maintained steady selling, while rebalancing in leveraged ETFs amplified the downturn. Taiwan was also down for the month, but to a far lesser degree. Elsewhere, the picture was more stable. Asia Pacific countries not tied to the AI trade generally rallied, including Hong Kong, Singapore, and Australia, while the United Kingdom and Europe also outperformed on the month, albeit with more muted returns. The U.S. Dollar Index closed lower for the month after falling sharply in the final few trading days. The result was a modest tailwind for domestic investors holding securities denominated in foreign currencies.
An uncertain path forward for interest rates
The Federal Reserve (Fed) kept its benchmark interest rate unchanged at a target range of 3.50% to 3.75%, the fifth consecutive hold. But the move was more contested than is typical, with three voting members wanting an immediate quarter-point hike—the first time since 2016 that three members dissented in the same direction. Chair Warsh continued to decline to offer strong forward guidance, and unexpectedly delivered a somewhat dovish message that drove longer-term yields higher on inflation expectations and led to a weaker dollar on the month. The futures market is currently pricing in roughly two-to-one odds of a rate hike in September’s meeting, with three-to-one odds of a hike by October, though expectations remain fluid.
Treasury yields climbed as inflation stayed sticky
The bond market sold off in July sending yields higher across the curve. The 10-year note finished July at 4.75% while the 2-year note ended at 4.28%. Treasury yields in general reached their highest levels of the year as Brent crude crested the $100-mark just days before the Fed’s meeting, reviving inflation concerns, and the aforementioned reaction to Chair Warsh’s press conference put further upward pressure on yields. The 3.3% Core PCE reading for June means inflation has now been above the Fed’s 2% target for more than five years.
Upcoming key events
- August 7: Monthly Employment Report (Nonfarm Payrolls & Unemployment Rate) released
- August 8: Berkshire Hathaway earnings released
- August 12: Consumer Price Index (CPI) data for July released
- August 19: FOMC Minutes from the July 28–29 meeting released
- August 20: Walmart earnings released
- August 26: Q2 GDP estimate released, Nvidia earnings released
- August 27–29: Federal Reserve’s Jackson Hole Economic Symposium
Chart of the month
The roller coaster for oil prices continued in July. Brent crude prices briefly crossed the $100/barrel mark near the end of the month before settling back, albeit slightly. The on-again, off-again nature of the ceasefire with Iran is making it nearly impossible to confidently spot a trend in prices. If there’s one lesson the conflict in the Middle East has driven home, it’s just how vulnerable the Strait of Hormuz is. Major energy producers are already working on developing alternative pipelines in the region, as the calculus involved in making those investments has clearly changed in recent months.
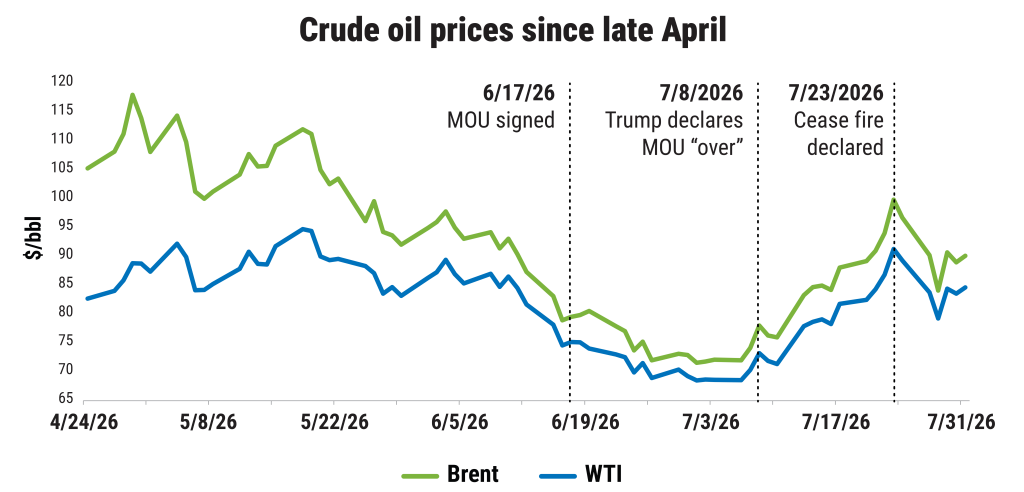
Source: Bloomberg, as of July 31, 2026. MOU stands for memorandum of understanding; WTI is short for West Texas Intermediate crude oil. Past performance does not guarantee future results. You cannot invest directly in an index. See below for additional definitions.
To learn more, contact us at [email protected].
Important information
Boston Partners Global Investors, Inc. (“Boston Partners”) is an investment adviser composed of two divisions, Boston Partners and Weiss, Peck & Greer Partners (“WPG”), and is an indirect, wholly owned subsidiary of ORIX Corporation of Japan (“Orix”). Boston Partners is affiliated with listed corporations through common ownership. ORIX Corporation Europe, N.V. services may be offered in the U.S. through Robeco Institutional Asset Management, U.S.
The views and opinions expressed may change based on market and other conditions. This material is provided for informational purposes only and should not be construed as investment advice. There can be no assurance that developments will transpire as forecasted. Actual results may vary. No investment strategy or risk management technique can guarantee return or eliminate risk in all market environments.
The Bloomberg U.S. Aggregate Bond Index tracks the performance of intermediate-term investment-grade bonds traded in the United States. Brent crude and West Texas Intermediate (WTI) crude are two types of more easily refined oil and serve as key benchmarks for oil prices. The Consumer Price Index is a commonly used measure of inflation that tracks the variation in prices paid by typical consumers for retail goods and other items. Hyperscalers are large-scale data centers used for cloud computing and data management, and can refer to the companies that provide such services. The MSCI EAFE Index tracks the performance of large- and mid-cap equities traded across global developed markets, excluding the United States and Canada. The MSCI Emerging Markets Index tracks the performance of large- and mid-cap equities traded in global emerging markets. The Russell 1000 Growth and Value Indexes track the performance of those large-cap U.S. equities in the Russell 1000 Index with growth and value style characteristics, respectively. The Russell 2000 Index tracks the performance of the 2,000 smallest companies traded in the United States. The S&P 500 Index tracks the performance of the 500 largest companies traded in the United States. It is not possible to invest directly in an index.
The breakpoints for capitalization ranges should be viewed only as guideposts and will change over time. In general, FTSE Russell (which maintains a number of stock-market indexes based on company size) considers small-cap stocks to have market caps of between $150 million and $7 billion, mid caps to have market caps between $7 billion and $150 billion, and large caps to be those companies with market caps above $150 billion.
8037497.18