
September 2026 | Monthly market recap
U.S. stocks were down slightly amid narrowed leadership and surging yields
U.S. large-cap stocks sold off slightly for the month, but the calm headline masked a sharp split underneath: Information Technology and Communication Services were the only sectors to advance, while Utilities, Real Estate, Materials, and Financials brought up the rear. During the month, Treasury yields climbed across the curve, as the Federal Reserve raised interest rates for the first time since 2023 in an attempt to tamp down persistent inflation; Brent crude, meanwhile, traded above $100 a barrel for much of September. Those pressures battered rate-sensitive and economically sensitive stocks, even as enthusiasm around artificial intelligence (AI) propelled a narrow group of technology leaders higher.
ONE-MONTH PERFORMANCE as of 09/30/2026 | ||||
|---|---|---|---|---|
U.S. large caps (S&P 500) | U.S. small caps (Russell 2000) | International developed (MSCI EAFE) | Emerging markets (MSCI EM) | Investment-grade bonds (Bloomberg Agg) |
-0.35% | -5.25% | -3.05% | -0.56% | -2.61% |
Source: Boston Partners; all data via individual index providers. Past performance does not guarantee future results. See below for definitions.
Growth led value in large caps while small caps slid
Beneath the surface, September’s clearest divides were by style and by size. Large-cap growth decisively outpaced large-cap value, and large caps held up far better than small caps, which tumbled amid rising yields. The style divide was less pronounced among smaller companies: Growth still led value among mid caps, but in small caps value and growth declined by nearly the same amount. Within Tech, AI-linked semiconductor stocks drove the gains, buoyed by heavy capital spending plans across the industry. Energy stocks, for their part, slipped even as crude prices stayed well above their August levels.
KEY ECONOMIC INDICATORS | |||||
|---|---|---|---|---|---|
GDP (Q2 vs. Q1) | Fed funds rate | 10-year UST | Inflation (CPI) | Jobs | |
Most recent | 2.2% | 3.75%–4.00% | 5.29% | 3.4% | 29,000 |
Prior reading | 2.5% | 3.50%–3.75% | 4.75% | 3.4% | 133,000 |
Sources: Gross domestic product (GDP) via the U.S. Bureau of Economic Analysis. Federal funds rate via the Federal Reserve Bank of St. Louis (FRED). 10-year U.S. Treasury (UST) rates via the U.S. Department of the Treasury. Inflation (CPI) and jobs (non-farm payroll figures) via the U.S. Bureau of Labor Statistics. All “most recent” data is for the month of September and is compared with the month prior, except for CPI, which is on a one-month lag. Note that GDP data is compared with the prior quarter.
A firmer dollar deepened losses in international stocks
Developed international markets fell notably in dollar terms and trailed U.S. large caps, and a firmer U.S. dollar (USD) deepened those losses for domestic investors holding foreign currency-denominated securities, with the USD gaining modestly against a broad mix of currencies and more decisively against the euro. Emerging markets held up considerably better than their developed international peers, with value stocks outpacing growth within the group and eking out a small gain for the month. The inflation backdrop was hardly unique to the United States: Fed Chairman Kevin Warsh noted that most advanced economies were contending with price pressures of their own.
The Fed raised rates for the first time in more than three years
The month’s most consequential policy event was the Federal Open Market Committee’s (FOMC) September 16 decision to raise the federal funds target range by a quarter point. The vote was unanimous, a notable shift from July, when a majority had preferred to wait for more information. At his press conference, Warsh framed the move squarely around inflation, saying “the plain fact is that inflation is too high and has been for too long.” He added that he found it hard to describe broad financial conditions as restrictive. The median projection placed the fed funds rate at 4.1% by year-end, which implied one more quarter-point increase, but Warsh himself declined to commit, remarking, “I’m not in the forward guidance business.” The Committee next meets on October 27–28, when investors will look for clues about whether a second increase is coming. The futures market is currently anticipating a roughly 1-in-5 chance of an outright hike at that meeting.
Treasury yields surged and the curve flattened
Treasury yields rose sharply across maturities, and the 10-year yield frequently closed above 5% in the second half of the month. Short-term yields, reflecting the Fed’s hike and expectations for further tightening, rose the most, resulting in a flatter curve. Asked about the rise in long-term rates, Warsh cited three forces: a strengthening economy, competition for capital as so-called hyperscalers raised funds to finance heavy investment, and geopolitical pressure on commodity prices. Higher yields weighed on equity valuations, most visibly in small caps and in rate-sensitive sectors such as Utilities and Real Estate.
Upcoming key events
- October 7: FOMC minutes from the September 15–16 meeting released
- October 13: Citigroup, Goldman Sachs, JPMorgan Chase, Wells Fargo report earnings
- October 14: CPI data for September released; Bank of America, BlackRock, Morgan Stanley report earnings
- October 28: FOMC policy decision announcement; Alphabet, Meta, Microsoft report earnings
- October 29: Q3 GDP advance estimate released; Apple, Amazon report earnings
Chart of the month
The jump in yields this past month was a relatively rare event—at 54 basis points, the last time the 10-year Treasury climbed this much in a single month was 2022. But higher yields aren’t necessarily a warning signal for investors. Both stocks and bonds have historically gone on to post gains over the three and twelve months following a spike in yields like the one in September. Whether history will repeat itself in the face of geopolitical conflict, stubbornly high inflation, and a looming midterm election remains to be seen.
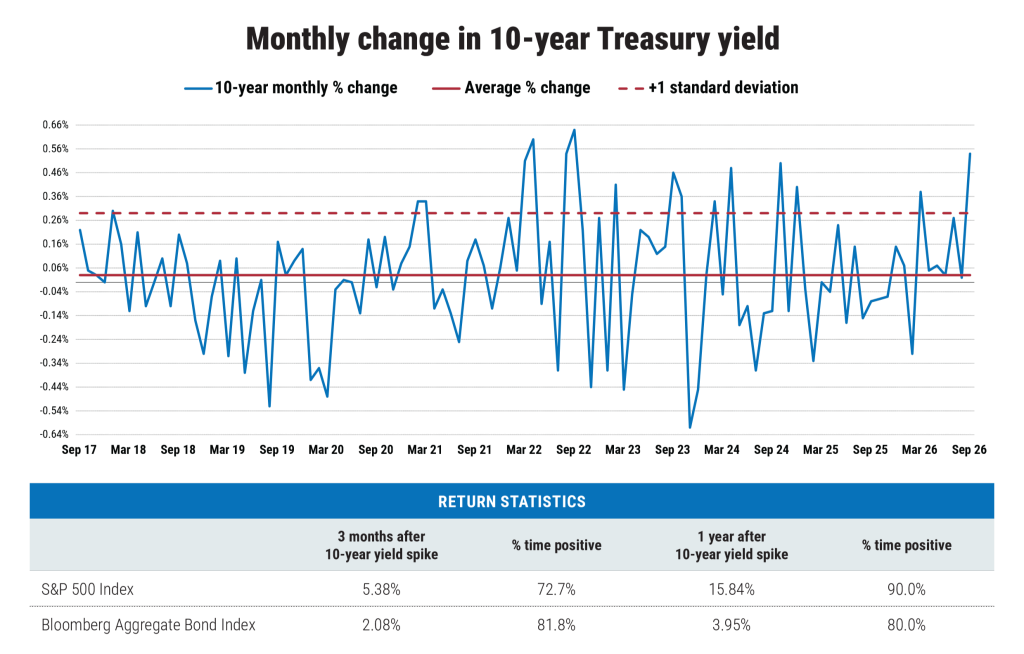
Source: Bloomberg, as of October 1, 2026.
Methodology: A “yield spike” is defined as a monthly increase in the 10-year Treasury yield greater than one standard deviation above the average monthly change over [period]. Results reflect [n] such events. Index returns are [total/price] returns. Past performance does not guarantee future results.
Past performance does not guarantee future results. See below for additional definitions.
To learn more, contact us at [email protected].
Important information
Boston Partners Global Investors, Inc. (“Boston Partners”) is an Investment Adviser registered with the Securities and Exchange Commission under the Investment Advisers Act of 1940. Registration does not imply a certain level of skill or training. Boston Partners Global Investors, Inc. (Boston Partners) is composed of three divisions, Boston Partners, Boston Partners Private Wealth, and Weiss, Peck & Greer (WPG) Partners, and is an indirect, wholly owned subsidiary of ORIX Corporation of Japan (ORIX).
The views and opinions expressed may change based on market and other conditions. This material is provided for informational purposes only and should not be construed as investment advice. There can be no assurance that developments will transpire as forecasted. Actual results may vary. No investment strategy or risk management technique can guarantee return or eliminate risk in all market environments.
The Bloomberg U.S. Aggregate Bond Index tracks the performance of intermediate-term investment-grade bonds traded in the United States. The Consumer Price Index is a commonly used measure of inflation that tracks the variation in prices paid by typical consumers for retail goods and other items. The MSCI EAFE Index tracks the performance of large- and mid-cap equities traded across global developed markets, excluding the United States and Canada. The MSCI Emerging Markets Index tracks the performance of large- and mid-cap equities traded in global emerging markets. The MSCI Emerging Markets Growth and Value Indexes track the performance of those emerging-market equities traded in the MSCI Emerging Markets Index with growth and value style characteristics, respectively. The Russell 1000 Growth and Value Indexes track the performance of those large-cap U.S. equities in the Russell 1000 Index with growth and value style characteristics, respectively. The Russell 2000 Index tracks the performance of roughly 2,000 small-cap companies traded in the United States. The Russell 2000 Growth and Value Indexes track the performance of those small-cap U.S. equities in the Russell 2000 Index with growth and value style characteristics, respectively. The Russell Midcap Growth and Value Indexes track the performance of those mid-cap U.S. companies in the Russell 1000 Index with growth and value style characteristics, respectively. The S&P 500 Index tracks the performance of the 500 largest companies traded in the United States. It is not possible to invest directly in an index.
Standard Deviation: A statistical of dispersion. When applied to fund returns, it is one measure of the expected range of future returns measure, i.e., volatility. The larger the standard deviation, the greater the likelihood that a security’s performance will fluctuate from the average return.
Basis Point: Basis points (bps) refers to a common unit of measure for interest rates and other percentages in finance. One basis point is equal to 1/100th of 1%, or 0.01%, or 0.0001, and is used to denote the percentage change in a financial instrument. The relationship between percentage changes and basis points can be summarized as follows: 1% change = 100 basis points and 0.01% = 1 basis point.
A yield spike is a sudden, sharp increase in the interest rates or returns paid by fixed-income securities like government bonds.
The breakpoints for capitalization ranges should be viewed only as guideposts and will change over time. In general, small-cap stocks have market caps of between $150 million and $7 billion, mid caps have market caps between $7 billion and $50 billion, and large caps have market caps above $50 billion.
8037497.20