Mullaney on the Markets
War or peace
By Michael Mullaney | Director of Global Markets Research
Published July 2025
Despite a flurry of events during the month that would normally act as a market headwind (Middle East bombings, a hawkish Fed meeting, accelerating inflation, congressional bickering, tariff turmoil), investors seemed willing to ignore the “noise” and “buy the dip,” sending the S&P 500 Index up 5.09% in June and to a new record high along the way. It took just 89 trading days for the S&P to surpass its prior record, the quickest recovery on record that included drawdowns of at least 15%. Bonds also regained their footing after a May loss, with the Bloomberg
U.S. Aggregate Bond Index (the Agg) advancing by 1.54% for the month. For the quarter the S&P 500 Index returned 10.94%, its best quarterly return since Q4 2023, while the Agg posted a more modest gain of 1.21%.
Year to date, the S&P 500 has rebounded from its Q1 loss of 4.28% to a gain of 6.20%, and the Bloomberg U.S. Aggregate Bond Index has returned 4.02%.
“Big Tech” led the way in June and for the quarter
The Information Technology and Communication Services sectors led for a second month in a row with an average return of 8.53% between them and were responsible for 75% of the S&P’s total monthly return. Only one sector posted a loss for the month, Consumer Staples, with the biggest drags to performance coming from Costco (down 4.83%) and Proctor & Gamble (down 6.22%).
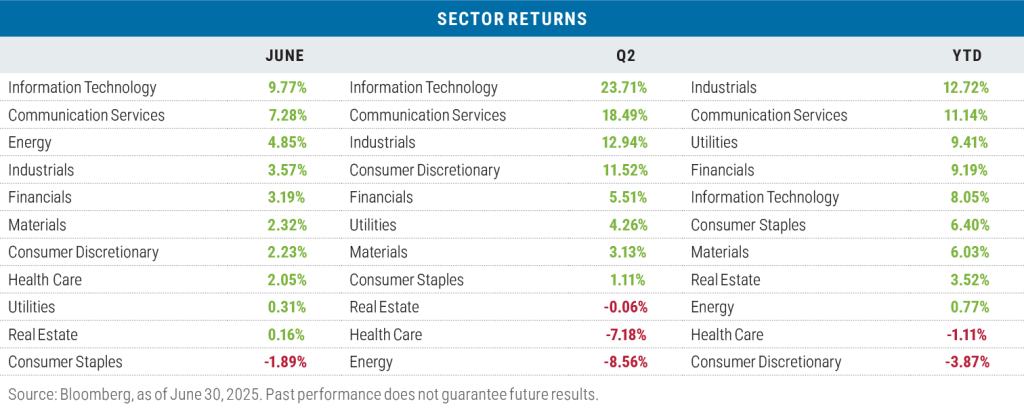
For the quarter, Information Technology and Communication Services also were the leaders with strong performances from Nvidia (up 46.78%), Microsoft (up 32.75%), and Broadcom (up 65.02%). In Communication Services, the sector was led by Meta Platforms (up 28.16%), Alphabet (up 13.91%), and Netflix (up 43.60%), when ranked on a contribution-to-return basis.
Energy was the laggard for the quarter, suffering from an increase in supply that dropped the price of oil from $71.48 a barrel at the start of the quarter to $65.11 at the end.
Heath Care came under assault from two fronts—favored nation pricing controls and potential tariffs—as the bulk of medicines used in the United States are produced elsewhere.
Year to date, Industrials were in the top spot, benefiting from the Trump administration’s reshoring efforts and favorable tax benefits that are part of the “One Big, Beautiful Bill.” Communication Services was in second place year to date due to two stocks, Meta Platforms (up 26.26%) and Netflix (up 50.24%). Combined, the two stocks have accounted for the vast majority of the sector’s return.
The Consumer Discretionary sector was pulling up the rear on a year-to-date basis with the bulk of the pain coming from one stock, Tesla, which has fallen by 21.34% given the effect of tariffs and the forthcoming expiration of federal electric vehicle tax credits.
Growth continued its lead in June
Growth beat value across all three Russell market capitalization ranges (large, mid, small) during the month with an average outperformance of 158 basis points across the three segments. The Russell 1000 Growth Index once again produced the biggest margin of outperformance relative to its counterpart, the Russell 1000 Value Index, finishing at 296 basis points, with 40% of the difference in return coming from of the Information Technology sector alone.
For the quarter, it was a similar story, though magnified, with growth beating value by 11.30% across the three capitalization ranges. The Russell 1000 Growth Index’s relative outperformance versus value was the widest margin since Q1 2020. As an aside, the 16.3% performance differential between the S&P 500 Growth Index and the S&P 500 Value Index during the quarter was the largest on record going back to 1995.
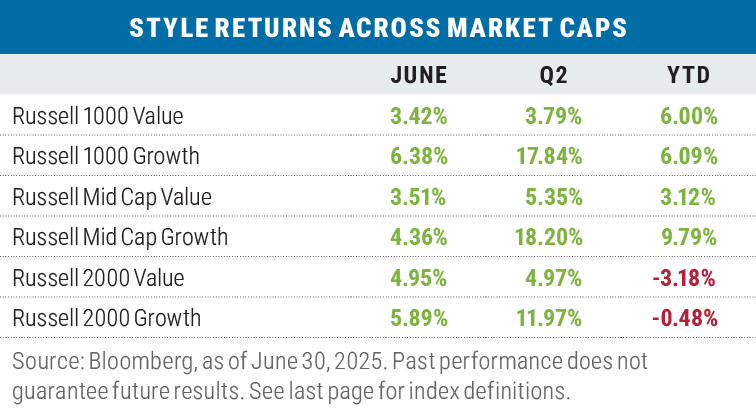
Year to date, the return of the Russell 1000 Value Index
is now neck-and-neck with that of the Russell 1000 Growth Index after the “Big Tech” rebound in Q2, though one stock in the value index, UnitedHealth Group (down 37.61% YTD) cost the 1000 Value Index almost 1% of relative performance.
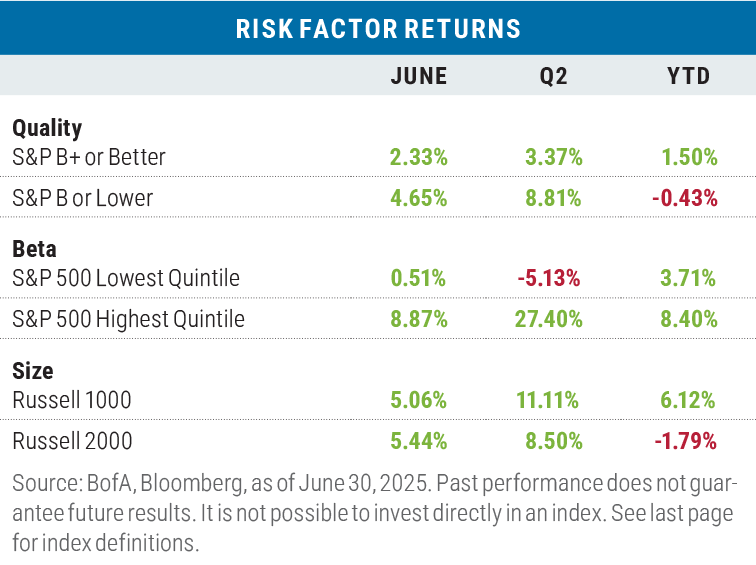
A “risk on” trifecta in June
Low-quality, high-beta, and small-size factors all outperformed their counterparts during the month. For the quarter “risk on” dominated—except for the size factor, where the spread was narrower—while year-to-date performance has remained tilted somewhat to “risk off” given that high quality and large size remain in the lead.
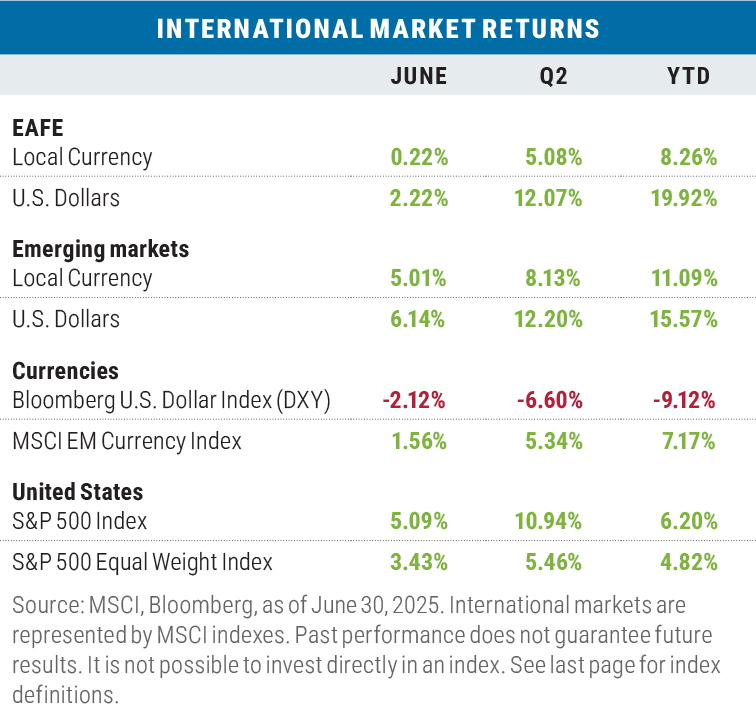
Non-U.S. stocks lagged the S&P 500 in local currency terms during June
Both developed- and emerging-market stocks lagged the cap-weighted S&P 500 in June in local currencies, though both had better returns in U.S. dollar (USD) terms as the dollar gave ground once gain during the month. For the quarter, both international benchmarks beat the S&P 500 in USD terms, while on a year-to-date basis international stocks maintained a comfortable lead over the S&P, particularly in USD terms.
The 9.12% loss for the Bloomberg U.S. Dollar Index for the YTD period is the worst start to a year on record for the index going back to 2004. The dollar has been hurt in the first half of the year by a bludgeoning current account and fiscal deficit and a narrowing of interest rate differentials.
Looking ahead
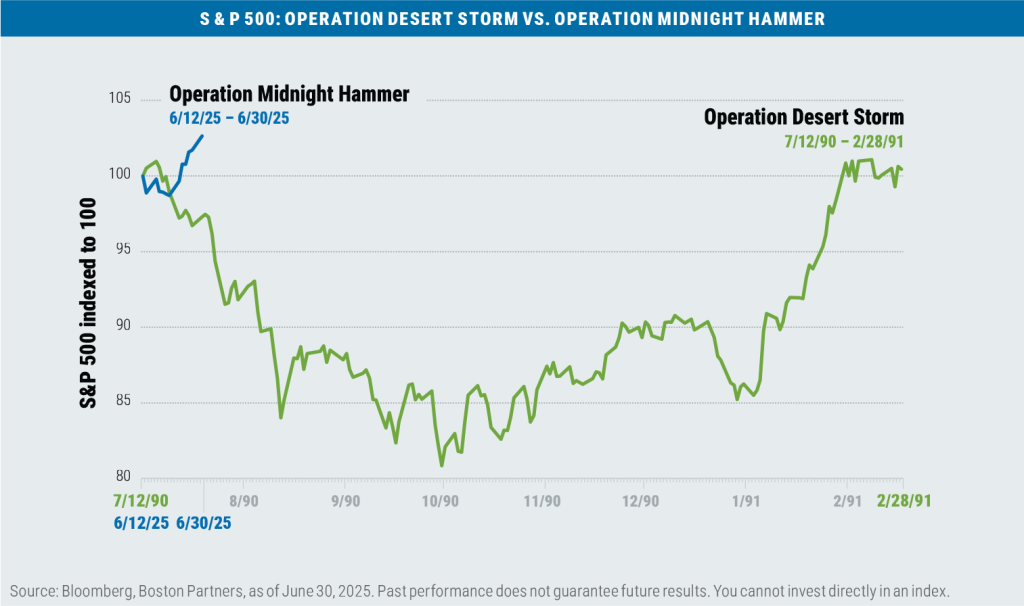
In what has been described as the largest B-2 operational strike in U.S. history, on June 21 seven B-2 Spirit bombers were used in a mission (dubbed “Operation Midnight Hammer”) to attack three nuclear sites in Iran: Fordow, Natanz, and Esfahan. The mission involved a 37-hour nonstop flight from Whiteman Air Force Base in Missouri, requiring multiple in-flight refuelings. How successful the mission was is still being determined; while it is known that severe damage was inflicted on the sites, whether they were “obliterated,” as President Trump stated, remains an open question and will impact how quickly the Iranians can restore their uranium enrichment program. Notably, the U.S. airstrike followed a surgical Israeli attack that began on June 13 and killed several top Iranian military leaders and prominent nuclear scientists.
For now, a tenuous truce is in place between the allied United States and Israel on one side and the Iranian government on the other. How long the truce will hold is unknown, but with Israel continuing in its effort to root out Iranian-backed Hamas in the Gaza Strip, a fl air-up in this geopolitical tinderbox could happen at almost any time.
The stock market for its part treated the incident as almost a non-event, especially when compared to the U.S. invasion of Iraq during “Operation Desert Storm.”
Meanwhile, back on U.S. soil, investors are left to ponder how President Trump’s “One Big, Beautiful Bill” will unfold considering that as of this writing it has been passed in the Senate and sent back to the House of Representatives for a final vote.
In its current form (which may not be final) the bill is projected to increase the primary deficit by $2.4 trillion over the next 10 years according to estimates from the Congressional Budget Office (CBO) and the Joint Committee on Taxation (JCT). The current guesstimate of what tariffs will bring in over the next 10 years is $1.6 trillion, though that figure is highly dependent on what transpires after the moratorium on tariffs expires on July 9 and to what extent retaliation by countries and consumers will affect the tariff tally.
As for the macroeconomic effect that tariffs will have on the United States in 2025 and 2026, the message is pretty consistent between the IMF, the OECD, and the World Bank.
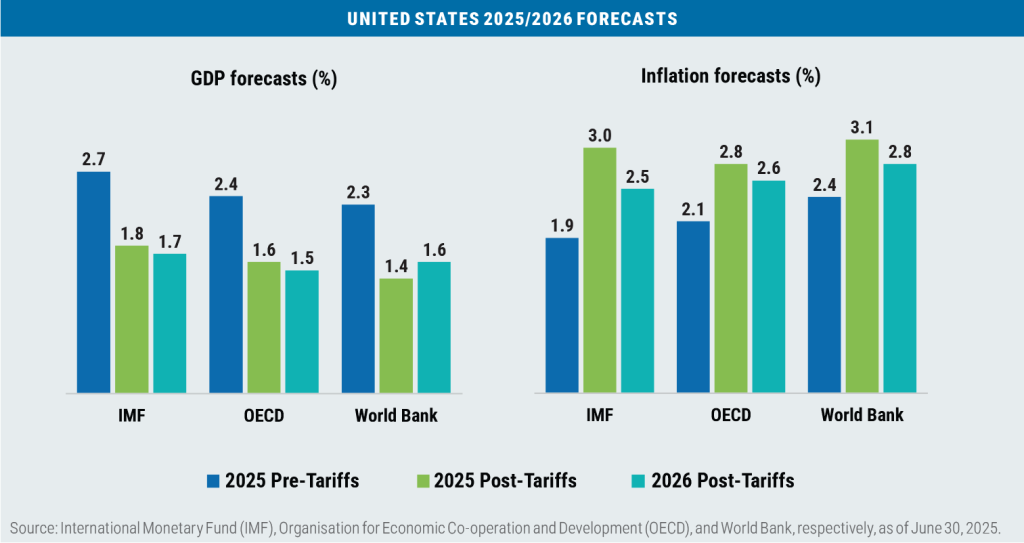
The takeaway: lower GDP growth and higher inflation, i.e., stagflation. This dovetails with what the Federal Reserve concluded at its June 18 meeting in their Summary of Economic Projections.
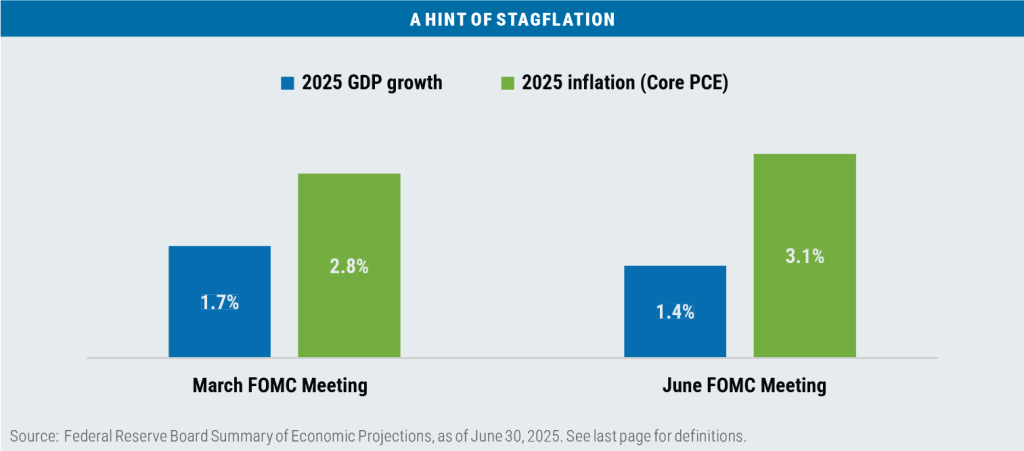
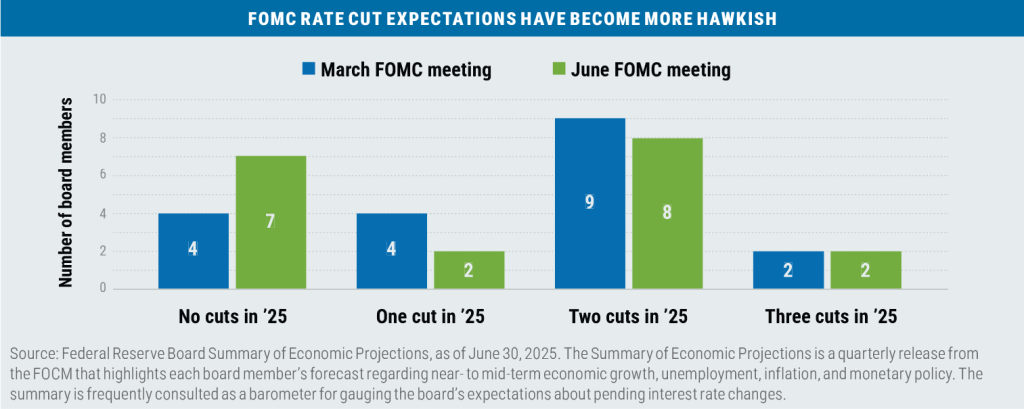
Those prediction in turn led to a more hawkish stance from the voting members of the Federal Open Market Committee (FOMC) regarding their rate cut intentions for 2025.
The Fed’s cautiousness seems well founded given that the Core Personal Consumption Price Index (the Fed’s favored inflation benchmark) increased to 2.7% in May on a year-over-year basis from 2.5% in April and remains well above the Fed’s 2.0% target.
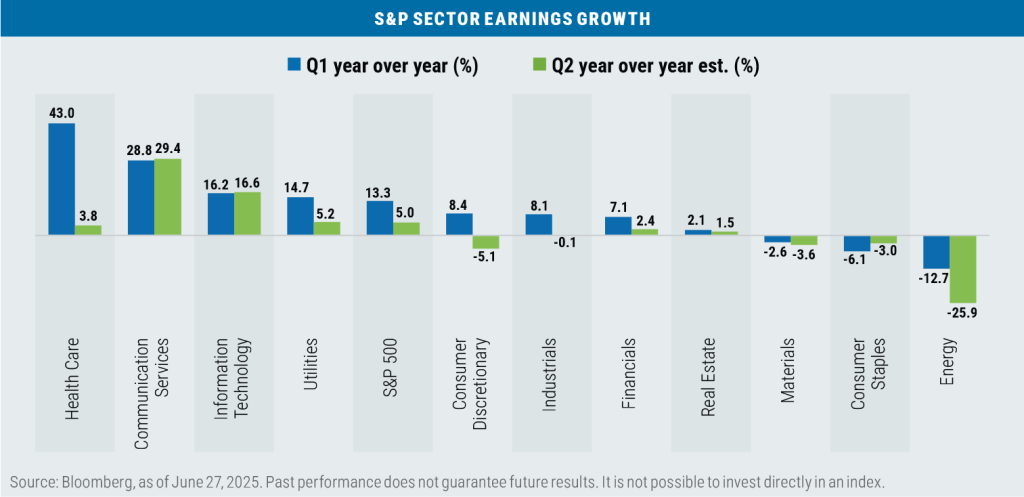
A bright spot for the S&P 500 has been earnings growth with the 1st quarter (reported during Q2), coming in at +13.3% versus a +7.2% estimate entering the period. While Q2 earnings growth for the S&P is expected to drop to +5.0%, over 75% of companies that have reported so far have continued to beat expectations. The earnings surprise for the S&P 500 since 2011 has averaged around 6%, so a number in excess of 5% for Q2 earnings is expected.
While the S&P has momentum on its side, a note of caution is also warranted as the VIX Index of implied volatility (also known as the “fear index”) had fallen back to 16.7 at month’s end, a level that invokes a sense of complacency, while the forward P/E multiple of the index has risen 22.09x, a level last seen on February 20, the day after the prior stock market peak.

Important disclosures
Boston Partners Global Investors, Inc. (“Boston Partners”) is an investment adviser composed of two divisions, Boston Partners and Weiss, Peck & Greer Partners (“WPG”), and is an indirect, wholly owned subsidiary of ORIX Corporation of Japan (“Orix”). Boston Partners is affiliated with listed corporations through common ownership. ORIX Corporation Europe, N.V. services may be offered in the U.S. through Robeco Institutional Asset Management, U.S.
Boston Partners Global Investors, Inc. (“Boston Partners”) is an investment adviser registered with the SEC under the Investment Advisers Act of 1940. The views expressed in this commentary reflect those of the author as of the date of this commentary. Any such views are subject to change at any time based on market and other conditions and Boston Partners disclaims any responsibility to update such views. Past performance is not an indication of future results.
Discussions of securities, market returns, and trends are not intended to be a forecast of future events or returns. You should not assume that investments in the securities identified and discussed were or will be profitable.
Terms and definitions
Beta is a measure of a portfolio’s market risk relative to its benchmark. In general, a beta higher than 1.00 indicates a more volatile portfolio and beta lower than 1.00 indicates a less volatile portfolio in relation to its benchmark. The Bloomberg U.S. Aggregate Bond Index tracks the performance of intermediate-term investment-grade bonds traded in the United States. The Bloomberg U.S. Dollar Index (DXY) is used to measure the value of the dollar against a basket of six foreign currencies. The value of the index is a fair indication of the dollar’s value in global markets. The Federal Open Market Committee (FOMC) is a rotating group of 12 members of the Federal Reserve system tasked with setting and implementing monetary policy. Forward P/E is a ratio that compares the current share price of a company to its estimated earnings per share over the next 12 months. The MSCI Emerging Markets (EM) Currency Index tracks the performance of emerging market currencies relative to the U.S. dollar where the weight of each currency is equal to its country weight in the MSCI Emerging Markets Index. The MSCI EAFE Index tracks the performance of large- and mid-cap equities traded across global developed markets, excluding the United States and Canada. The MSCI Emerging Markets Index tracks the performance of large- and mid-cap equities traded in global emerging markets. Personal Consumption Expenditures (PCE) are a measure of inflation tracked by the U.S. Bureau of Economic Analysis and measures the prices paid by consumers for goods and services; the “core” variety excludes food and energy prices. The Russell 1000 Index tracks the performance of the 1,000 largest companies traded in the United States. The Russell 2000 Index tracks the performance of the 2,000 smallest companies traded in the United States. The Russell 1000 Growth and Value Indexes track the performance of those large-cap U.S. equities in the Russell 1000 Index with growth and value style characteristics, respectively. The Russell 2000 Growth and Value Indexes track the performance of those small-cap U.S. equities in the Russell 2000 Index with growth and value style characteristics, respectively. The Russell Midcap Growth and Value Indexes track the performance of those mid-cap U.S. companies in the Russell 1000 Index with growth and value style characteristics, respectively. The S&P 500 Index tracks the performance of the 500 largest companies traded in the United States. The S&P 500 Equal Weight Index also tracks the performance of the 500 largest companies traded in the United States, but weights each company equally, rather than proportionally according to market cap. S&P credit ratings, which range from AAA (highest) to D (default), are assigned by S&P Global to individual companies to indicate their relative creditworthiness. The VIX, or CBOE Volatility Index, tracks expectations for future volatility of the stock market based on the prices of underlying S&P 500 Index options. It is not possible to invest directly in an index.
Market capitalization breakpoints
The breakpoints for capitalization ranges should be viewed only as guideposts and will change over time. In general, FTSE Russell (which maintains a number of stock-market indexes based on company size) considers small-cap stocks to have market caps of between $150 million and $7 billion, mid caps to have market caps between $7 billion and $150 billion, and large caps to be those companies with market caps above $150 billion.
8147666.1