Mullaney on the Markets
The Times They Are A-Changin’
By Michael Mullaney | Director of Global Markets Research
Published September 2025
U.S. stocks advanced for a fourth month in a row in August with a return of 2.03% for the S&P 500 Index, which hit five new record highs along the way, marking a total of twenty for the year. In a sign of a broadening base of returns, the Equal-Weighted S&P 500 returned 2.69% during the month.
Bonds also advanced with the Bloomberg U.S. Aggregate Bond index gaining 1.20% as yields fell by an average of 22 basis points for Treasury securities with maturities ranging from 2 to 20 years. The yield of the 2-year Treasury, the maturity most sensitive to actions by the Federal Reserve, fell by 34 basis points in anticipation of a September rate cut from the Fed, while the yield on the 30-year Treasury actually increased by 3 basis points over the month, most likely a reflection of the ongoing concerns about inflation.
Investor spirits were lifted by Federal Reserve Chair Jerome Powell when he indicated at the conclusion of the Fed’s annual Jackson Hole economic symposium that rate cuts were on the immediate horizon, a departure from previous comments regarding the Fed’s intentions. Looming challenges to the Federal Reserve’s independence, the ongoing game of “tariff tether ball,” and the potential for a government shutdown were all largely ignored by investors.
Year to date, the S&P 500 has gained 10.78%, and the Bloomberg U.S. Aggregate Bond Index has returned 4.99%.
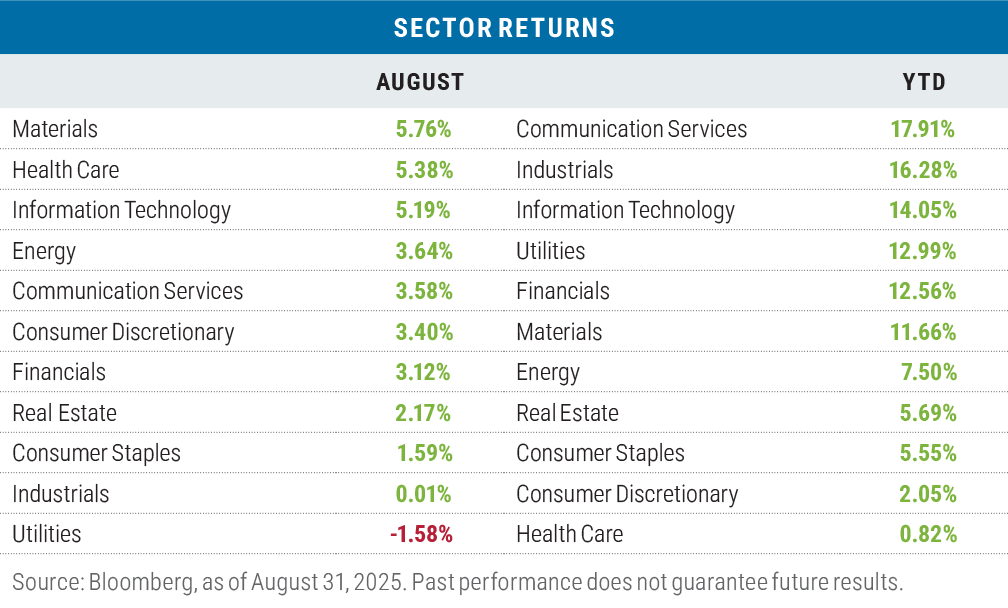
A cyclical sector and a downtrodden sector led the pack in August
The possible resumption of a Fed easing cycle coupled with optimism regarding a tariff deal with the European Union helped lift the Materials sector to the pole position in August, narrowly beating out the Health Care sector, which through July had been the worst performing sector within the S&P 500. Despite the sector’s strong performance in August, Health Care remains the laggard on a year-to-date basis.
The Utilities sector, which through July had been the second best performing sector of the S&P 500, was the only sector to finish August in the red, hurt by weakness in companies that provide energy to artificial intelligence (AI) data centers. NRG Energy, a stock that had more than doubled over the last year, was the worst performing stock in the sector during the month, dropping by 12.71% on lower-than-expected demand as reflected by the company’s long-term energy contracts.
Year to date, the Communication Services sector crept ahead of the Industrials sector, helped by a 35.56% return for Netflix and a 26.37% return for Meta Platforms, the latter of which, due to its weight within the sector, was responsible for 42% of the overall sector return.
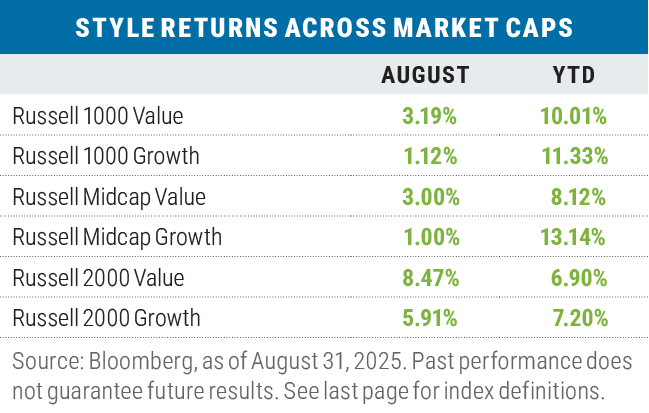
Value beat growth across all capitalization segments in August
August brought the best combined performance for value over growth (+2.21%) since March, though the sectors that drove value’s outperformance varied by capitalization range. In large caps, the Health Care sector provided the biggest boost for the Russell 1000 Value Index where it contributed 30% of the outperformance. In mid caps, Industrials contributed 44% of the Russell Midcap Value’s outperformance and in small caps, Financials provided 70% of the Russell 2000 Value’s outperformance.
Year to date, growth leads value by (coincidentally) +2.21% again when averaged across the three capitalization ranges of the respective Russell benchmarks. Growth’s greatest advantage for the year is now in the mid-cap space where the Russell Midcap Growth Index leads the Russell Midcap Value Index by 5.02%; the Health Care sector accounts for 37% of mid-cap growth’s lead over value.
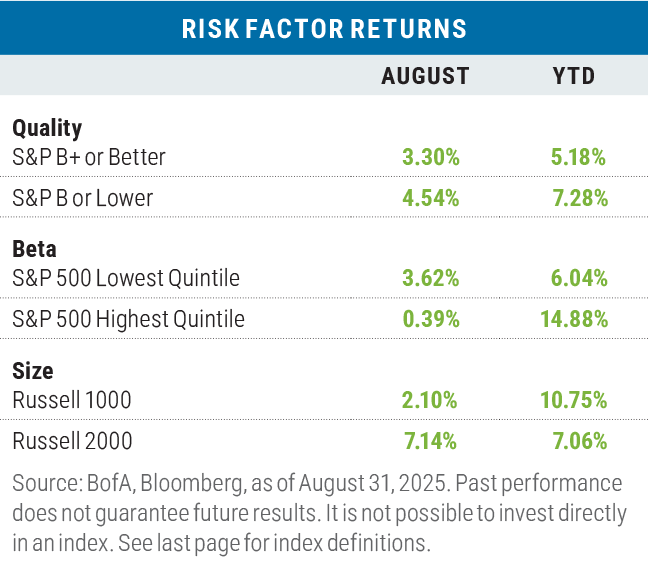
“Risk on” for two out of three factors in August
Low-quality and small size factors outperformed their counterparts during the month, while the highest beta quintile of the S&P 500 lagged the lowest beta quintile. Small-cap stocks rallied on hope that a series of rate cuts that would lower those companies’ financing costs, as approximately 38% of small companies’ borrowing is pegged to a floating rate. High beta was hurt by the returns of mega-cap tech stocks like Nvidia (with a beta of 2.04), which declined by 2.07% during the month and represents over 8% of the S&P 500 Index. Year to date, only the small size factor has missed out on the “risk on” theme that has prevailed throughout
the year.
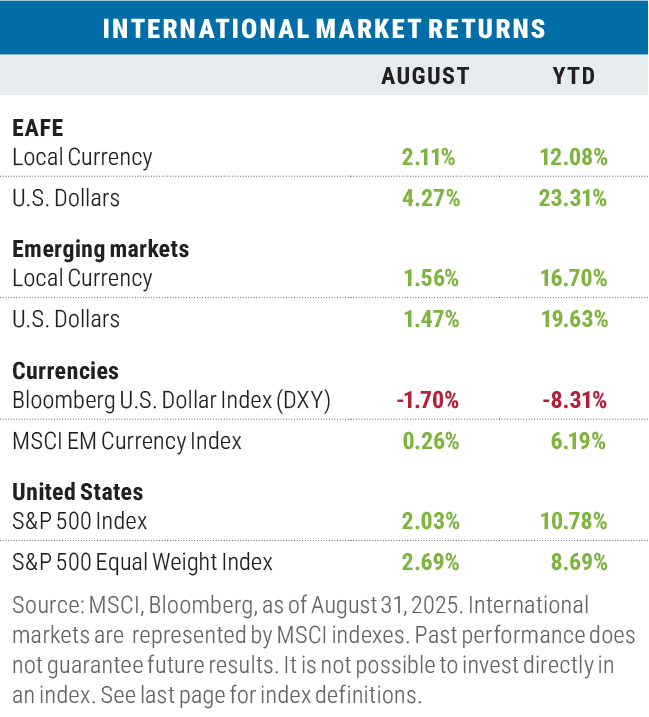
Mixed results for non-U.S. stocks again in August
In local currency terms and more so in U.S. dollar (USD) terms, developed-market international stocks outperformed the S&P 500 on a cap-weighted basis as the U.S. dollar continued to give ground versus the currencies of the ten largest U.S. trading partners that make up the Bloomberg DXY Dollar Index.
Emerging-market returns, while positive, lagged the S&P benchmarks during the month. The MSCI EM Index was hurt by losses in Poland (down 4.29%) and the United Arab Emirates (down 4.73%) and if not for the return posted by China (up 4.89%), the index would have declined by 0.23%.
Year to date, developed- and emerging-market stocks continued to lead the S&P 500, in both USD and local currency terms as global investors have increased their exposure to non-U.S. stocks.
Looking ahead
As we head into September, investors will be confronted with navigating a series of market, economic, and geopolitical challenges:
- By how much will the Fed cut interest rates?
Answer: Fed Funds futures are pricing a 95% probability to a 25-basis point cut. No cut in September would be a major surprise for both the stock and bond market.
- Is a rate cut really necessary?
Answer: With 4.2% unemployment, gross domestic product (GDP) growth of 3.3% in Q2, and overall financial conditions (as measured by the Chicago Fed) 18% looser than the 10-year average, many economists feel a rate cut is not necessary. Also, Core PCE at 2.9% remains well above the Fed’s 2% target for inflation. Arguments for a cut are centered around slowing job growth and a slight uptick in layoffs that Chair Powell cited in his speech at the Fed symposium at Jackson Hole.
- Will President Trump’s pick of Stephen Miran get the votes needed to finish Federal Reserve Board member Adriana Kugler’s term through January 31, 2026?
Answer: With Senate confirmation needed for Miran’s appointment and Republicans holding a 53 to 47 majority in the Senate, Miran’s confirmation is highly likely—unless four Republican senators take issue with Miran’s positions that include decreasing the terms of members from fourteen years to eight years, allowing members to be fired by the president, and allowing state governors to appoint Federal Reserve bank board members.
- Will President Trump succeed in firing Lisa Cook as a member of the Federal Reserve Board of Governors?
Answer: If claiming two residencies (and maybe a third) as her primary residence on mortgage applications is found to be mortgage fraud, and mortgage fraud is found to qualify as just cause, then President Trump will have the authority to fire Cook and nominate a successor. The Senate is responsible for confirming Trump’s replacement appointment. Cook’s term is scheduled to run through January 2038.
- Who will be President Trump’s nominee be to replace Fed Chair Jerome Powell?
Answer: It’s unclear, but the Polymarket betting site reports the following odds: Fed Governor Christopher Waller at 35%, who was nominated as a Fed Governor by President Trump during his first administration; Director of the National Economic Council Kevin Hassett at 11%; and former Fed Governor Kevin Warsh at 9%.
- Can a government shutdown on October 1st be avoided?
Answer: Yes, if Congress passes a full year appropriations bill or a continuing resolutions bill, though 60 Senate votes are needed to pass the former. Only a majority of votes in the House of Representatives is needed to pass a continuing resolution and there the Republicans hold a 220 to 213 advantage. In the Senate, only a majority is needed to pass a continuing resolution bill as well, but that is only if a filibuster is avoided. To get a “clean” appropriations bill passed at least eight Senate Democrats would need to cross over the aisle. Given the level of partisanship in Wash- ington, a kick-the-can-down-the-road continuing resolution bill may be the most likely outcome.
- Will the tariffs that have been imposed be deemed illegal?
Answer: While the U.S. Court of Appeals for the Federal Circuit did rule that President Trump’s tariffs imposed under the International Emergency Economic Powers Act (IEEPA) were illegal, it is widely expected that the ruling will wind up in the Supreme Court. Of the nine Supreme Court justices, six were appointed by Republican presidents and three by Democratic presidents. While we are not legal scholars, the math is fairly compelling for that outcome. Also, even if the tariffs are considered to be illegal under the IEEPA, President Trump could still pursue them under Section 232 of the 1962 Trade Expansion Act or Section 301 of the Trade Act of 1974. Either way, it seems highly likely the bulk of the tariffs imposed will stick.
- Are the concentration levels in the S&P 500 a risk to the overall market?
Answer: At nearly 40%, the weight of the top 10 stocks in the S&P 500 is at an all-time high. But historically, over a 10-year period the composition of those top 10 securities has tended to change significantly. For example, only five of the top 10 stocks in the S&P 500 at the end of
2015 remained on that list in August 2025—Amazon, Berkshire Hathaway, Apple, JPMorgan, and Microsoft. In fact, only one stock—Microsoft—has remained in the top ten since 2000.
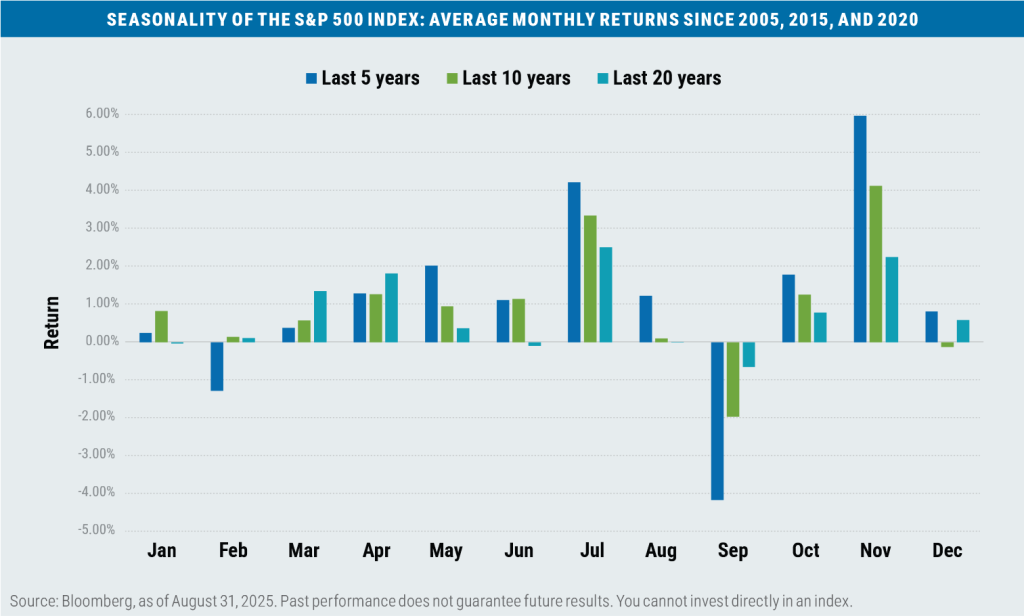
- Will September’s history of being the worst month of the year for stock returns continue?
Answer: Given all of the noise listed above, it would not be unusual for the S&P 500 to follow its historical pattern this September. Time will tell.

Important disclosures
Boston Partners Global Investors, Inc. (Boston Partners) is composed of three divisions, Boston Partners, Boston Partners Private Wealth, and Weiss, Peck & Greer (WPG) Partners, and is an indirect, wholly owned subsidiary of ORIX Corporation of Japan (ORIX).
The views expressed in this commentary reflect those of the author as of the date of this commentary. Any such views are subject to change at any time based on market and other conditions and Boston Partners disclaims any responsibility to update such views. Past performance is not an indication of future results.
Discussions of securities, market returns, and trends are not intended to be a forecast of future events or returns. You should not assume that investments in the securities identified and discussed were or will be profitable.
Terms and definitions
Beta is a measure of a portfolio’s market risk relative to its benchmark. In general, a beta higher than 1.00 indicates a more volatile portfolio and beta lower than 1.00 indicates a less volatile portfolio in relation to its benchmark. The Bloomberg U.S. Aggregate Bond Index tracks the performance of intermediate-term investment-grade bonds traded in the United States. The Bloomberg U.S. Dollar Index (DXY) is used to measure the value of the dollar against a basket of six foreign currencies. The value of the index is a fair indication of the dollar’s value in global markets. Gross domestic product (GDP) is the total market value of all the goods and services produced by a country and is a closely watched reflection of overall economic health.. The MSCI Emerging Markets (EM) Currency Index tracks the performance of emerging market currencies relative to the U.S. dollar where the weight of each currency is equal to its country weight in the MSCI Emerging Markets Index. The MSCI EAFE Index tracks the performance of large- and mid-cap equities traded across global developed markets, excluding the United States and Canada. The MSCI Emerging Markets Index tracks the performance of large- and mid-cap equities traded in global emerging markets. Personal Consumption Expenditures (PCE) are a measure of inflation tracked by the U.S. Bureau of Economic Analysis and measures the prices paid by consumers for goods and services; the “core” variety excludes food and energy prices. The Russell 1000 Index tracks the performance of the 1,000 largest companies traded in the United States. The Russell 2000 Index tracks the performance of the 2,000 smallest companies traded in the United States. The Russell 1000 Growth and Value Indexes track the performance of those large-cap U.S. equities in the Russell 1000 Index with growth and value style characteristics, respectively. The Russell 2000 Growth and Value Indexes track the performance of those small-cap U.S. equities in the Russell 2000 Index with growth and value style characteristics, respectively. The Russell Midcap Growth and Value Indexes track the performance of those mid-cap U.S. companies in the Russell 1000 Index with growth and value style characteristics, respectively. The S&P 500 Index tracks the performance of the 500 largest companies traded in the United States. The S&P 500 Equal Weight Index also tracks the performance of the 500 largest companies traded in the United States, but weights each company equally, rather than proportionally according to market cap. S&P credit ratings, which range from AAA (highest) to D (default), are assigned by S&P Global to individual companies to indicate their relative creditworthiness. It is not possible to invest directly in an index.
Market capitalization breakpoints
The breakpoints for capitalization ranges should be viewed only as guideposts and will change over time. In general, FTSE Russell (which maintains a number of stock-market indexes based on company size) considers small-cap stocks to have market caps of between $150 million and $7 billion, mid caps to have market caps between $7 billion and $150 billion, and large caps to be those companies with market caps above $150 billion.
8373951.1