Mullaney on the Markets
Technical foul
By Michael Mullaney | Director of Global Markets Research
Published July 2026
The S&P 500 Index fell 0.95% in June, the benchmark’s first loss since March, largely due to growing doubts regarding the massive expenditures numerous companies have made on artificial intelligence (AI) initiatives and their capacity to recoup their investments.
AI hyperscalers were particularly hard hit, dropping by 14.50% during the month as measured by an equally weighted basket of Alphabet, Amazon, Meta Platforms, Microsoft, and Oracle. Losses during the month were also incurred by the Magnificent Seven (down 8.81%) and the S&P 500 Information Technology sector (down 3.28%). The Tech sector had been down as much as 5.74% on an intra-month basis, but that was somewhat alleviated by a 1.14% “buy-the-dip” gain during the last five trading days of the month. Excluding the Tech sector, the rest of the S&P 500 gained 0.37% for the month while the S&P 500 Equal Weighed Index gained 2.37%; the latter index benefited from a significantly reduced sector weight (and therefore return contribution) for Technology, down from 38% to 9%.
International stocks also gave up ground during the month with the MSCI World ex United States Index falling by 0.14%. Bonds also struggled during June as the Bloomberg U.S. Aggregate Bond Index (the “Agg”) gained a scant 0.24%, with coupon income needed to offset price losses from rising interest rates for a fourth consecutive month. A hawkish meeting of the Federal Open Market Committee (FOMC) that signaled at least one rate hike by year’s end also put a damper on the bond market, as did newly appointed Fed Chair Kevin Warsh’s decision to curtail forward Fed guidance to investors.
The returns for the quarter ending in June were a different story, with the S&P 500 gaining 15.20%, the benchmark’s best quarterly return since June 2020 and dwarfing the Agg’s return of 0.67%. During the quarter, the S&P 500 Information Technology sector jumped 31.79%, led by a 43.99% increase in the benchmark’s semiconductor subindex. Ex-technology, the S&P gained 6.68% over the quarter.
For the six months ending in June, the S&P 500 was up 10.19%, while its equally weighted version returned 12.11%. Bonds inched ahead by 0.62% through June and the MSCI World ex United States Index gained 9.63%.
Sector returns in June
Sector returns
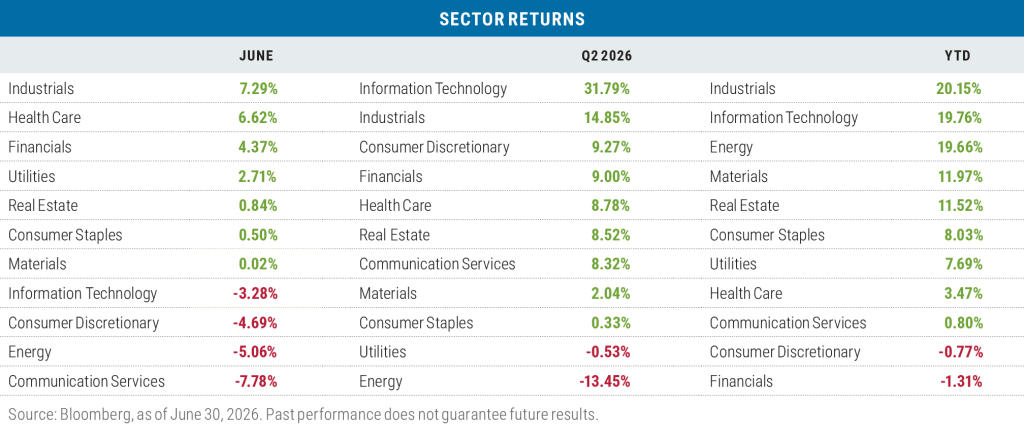
During June, Industrials had the best return of the eleven sectors that comprise the S&P 500—and with an index weight of 8.63%, Industrials had the greatest contribution to the S&P’s return as well. Two stocks—Caterpillar (up 21.58%) and GE Vernova (up 21.39%)—were responsible for 38% of the sector’s return during the month as both companies continued to benefit from the AI buildout and the United States’ reshoring efforts. (Think “picks and shovels” versus “high tech.”)
Health Care came in second for the month, helped by GLP-1 weight loss leader Eli Lilly’s return of 8.55%, which was responsible for 21% of the sector’s overall return.
Pulling up the rear for the month was the Communication Services sector where two AI hyperscalers—Alphabet (down 6.02%) and Meta (down 10.86%)—were responsible for 75% of the sector’s loss.
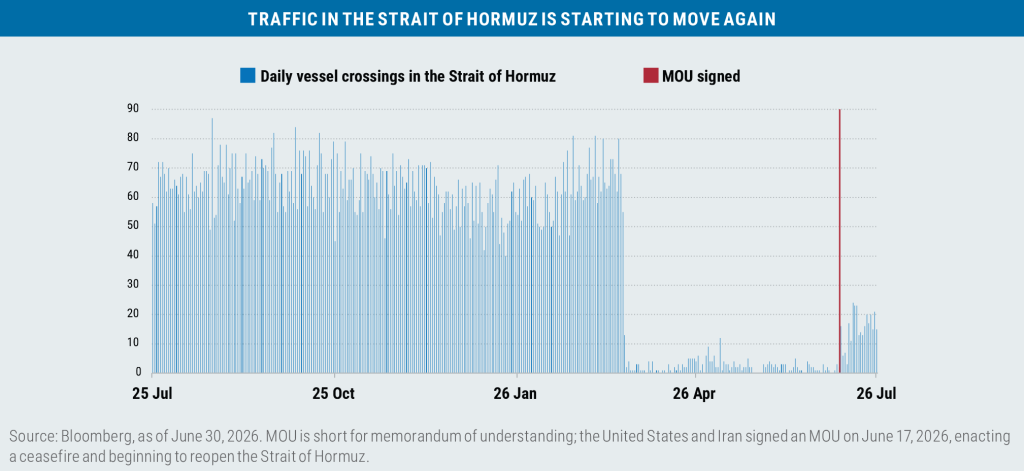
Energy stocks also suffered as the United States and Iran signed the Islamabad Memorandum of Understanding on June 17 to officially end their recent war, reopen the Strait of Hormuz, and begin a 60-day negotiation period, which led to oil prices (as measured by West Texas Intermediate crude) falling from $87.36 per barrel on May 29 to $69.50 on June 30.
For the quarter, the Information Technology sector was the clear-cut winner, responsible for 67% of the S&P’s overall return. Of the 75 stocks that make up the Technology sector in the S&P 500, one stock, Micron Technology, was responsible for 15% of the sector’s 31.79% return with an outlandish return of 241.67% over the quarter, driven by the hyperscalers’ almost insatiable demand for computer memory chips. Energy once again was the sector laggard with oil prices down from $101.38 per barrel on March 31 to $69.50 over the three-month period.
With the strong return generated in June, Industrials took the lead on a year-to-date basis for all S&P 500 sectors. Once again Caterpillar and GE Vernova were the driving force,
accounting for 39% of the sector’s return. Technology had the second strongest return year to date at 19.76%, and because of the sector’s 34.88% weight in the S&P 500, it was once again responsible for the bulk (roughly 65%) of the overall return for the index in the first half of 2026. Financials were the laggard over the year-to-date period; a loss in the Financial Services sub-sector (down 4.76%) offset gains in both Banks (up 5.21%) and Insurance (up 0.80%).
Value leads again in June
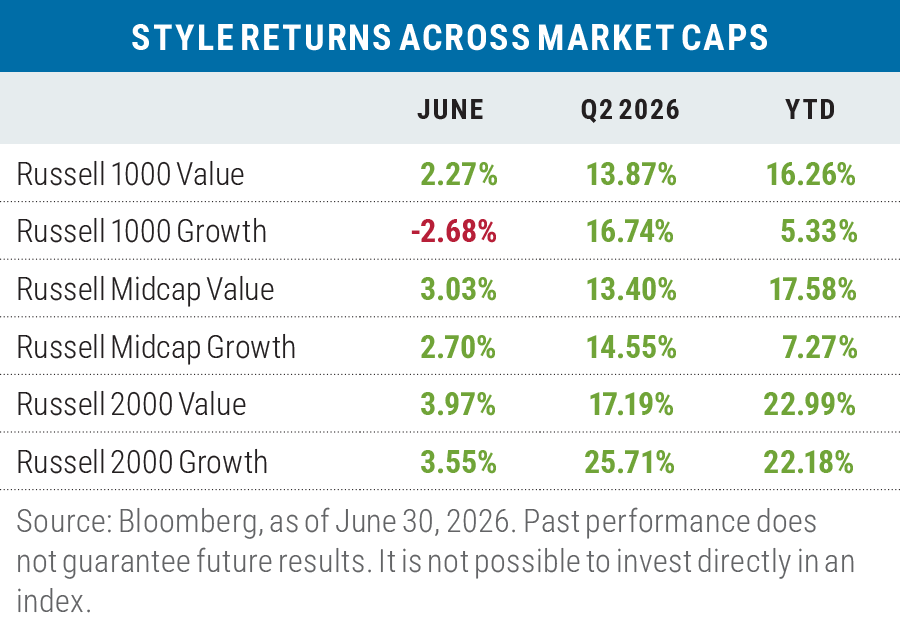
Value stocks led their growth counterparts by 1.90% in June when averaged across the three Russell market capitalization ranges, though the large-cap segment of the value indexes was the dominant contributor with the Russell 1000 Value Index beating the Russell 1000 Growth Index by +4.95%. The Technology sector in both large-cap benchmarks was the primary driver of the return differential, with the Russell 1000 Value Tech sector returning 6.05% during the month and the Russell 1000 Growth Tech sector falling by 5.43%. The single most significant Tech stock in value for the month was Micron Technology with a return of 16.61%, making it responsible for 49% of the sector’s gain; for growth, it was Microsoft, which declined 17.15% and was responsible for 54% of that sector’s loss.
For the quarter, growth led value by an average of 4.18% across the three capitalization ranges, but in a twist, it was the small-cap segment of the market where growth had the greatest impact on the average: the Russell 2000 Growth Index returned 25.71% versus the 17.19% return generated by the Russell 2000 Value Index. Also, instead of Tech driving the return differential it was the Energy sector, which fell by 13.15% in the Russell 2000 Value Index, but only by 2.40% in the Russell 2000 Growth Index. The Russell 2000 Value Index also had roughly 5% more exposure to energy than the Russell 2000 Growth Index.
Year to date, value is leading growth by an average of 7.35%, and once again the large-cap segment was the dominant factor with the Russell 1000 Value Index returning 16.26% versus the 5.33% return of the Russell 1000 Growth Index; that spread represents the largest six-month differential for large-cap value versus growth since June 2022. Technology was once again the driving force behind the return differential, with the Tech sector gaining 88.87% in the Russell 1000 Value Index versus 7.27% in the Russell 1000 Growth Index; Micron Technology was responsible for 31% of that differential.
Mixed factor results in June
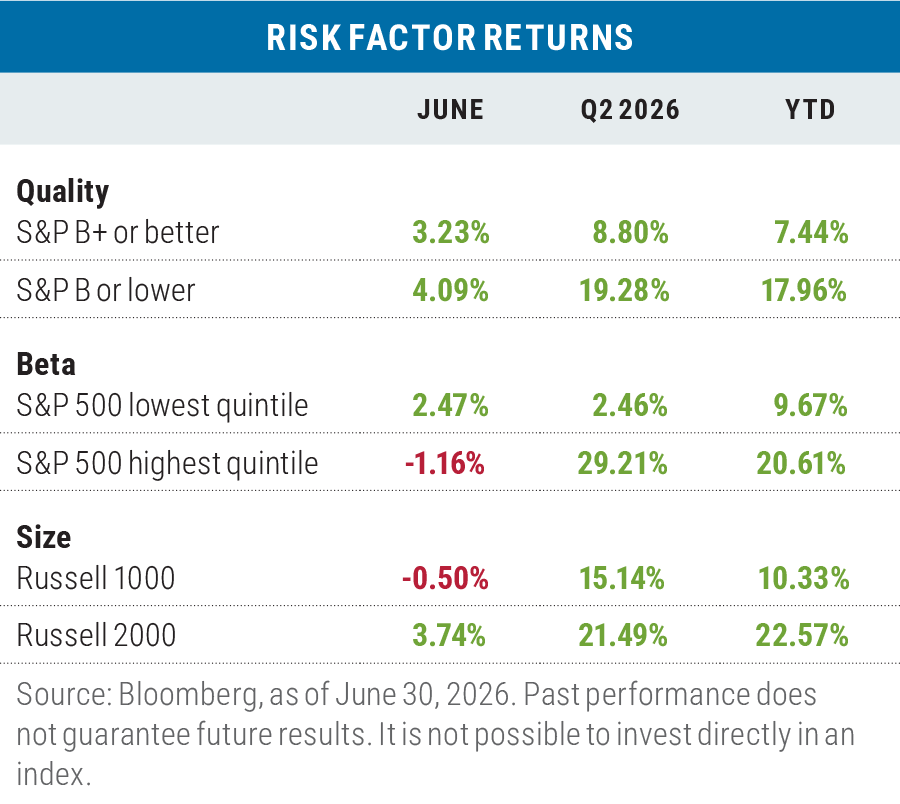
In June, factor returns were tilted more towards risk on than risk off, as both lower quality and small size prevailed, while low-beta edged out high beta for the month. For the quarter and year-to-date periods, risk on was clearly in the lead, with low-quality, high-beta, and small-sized stocks all outperforming.
Muddled returns for non-U.S. stocks in June
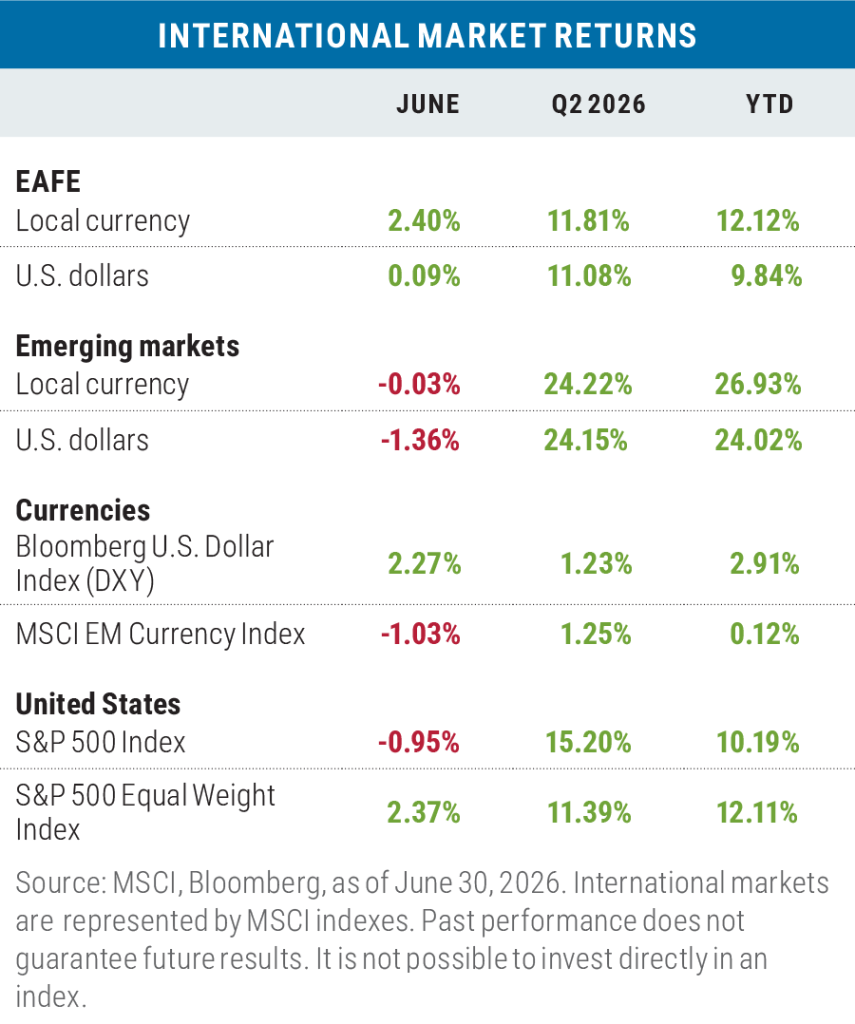
Developed market international stocks (as measured by the MSCI EAFE Index) beat the S&P 500 in June in both local currency and U.S. dollar (USD) terms, while emerging market stocks outpaced the S&P in local currencies but lagged in USD terms; emerging market currencies fell by 1.03% versus the dollar during the month. The DXY U.S. Dollar Index’s returns were up 2.27% versus a basket of six major foreign currencies, as the Federal Reserve indicated that a rate hike was on the table; heightened dollar demand from World Cup visitors to the United States was also a factor.
For the quarter and year-to-date period, emerging market stocks handily beat the S&P 500 in local currency and dollar terms, led by South Korea (up 89.58% and 133.95% in local currency, respectively) and Taiwan (up 47.99% and 63.98% in local currency, respectively). Both countries benefited from significant exposures to the semiconductor industry.
Developed market stocks lagged the S&P 500 during the quarter; the MSCI EAFE had just a 12% weight in the Technology sector versus 38% for the S&P. Year to date, the MSCI EAFE Index beat the S&P in local currencies but lagged in USD terms as the DXY Index gained 2.91%. The euro makes up nearly 57% of the DXY Index and has fallen by 2.57% versus the dollar over the first half of 2026.
Looking ahead
There’s no question that the current and projected level of capital expenditures by the AI hyperscalers is contributing to doubts about whether and when that spending can be monetized (see: Meta).
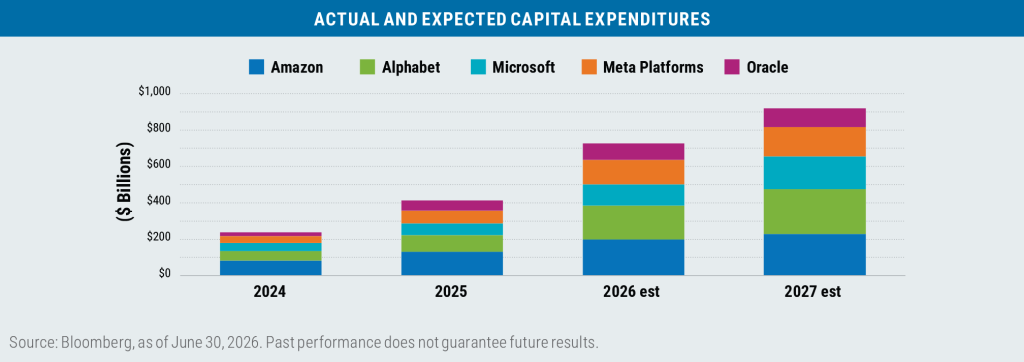
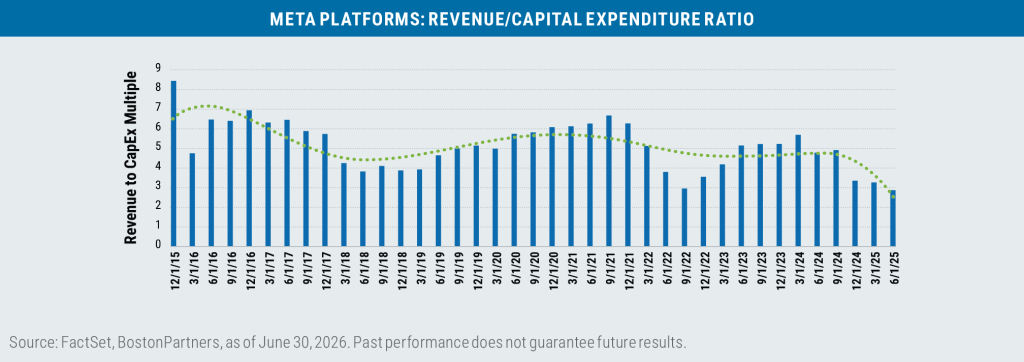
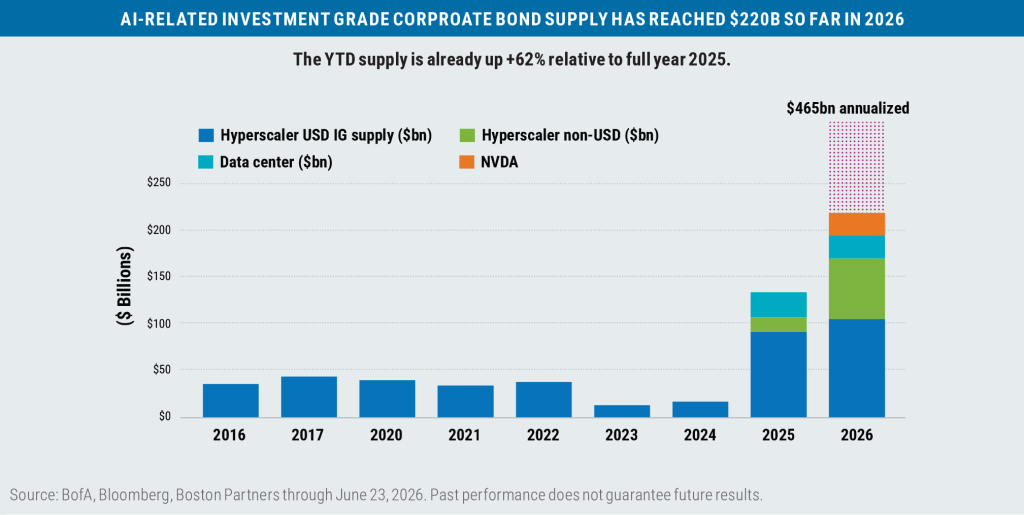
To date, the spending on the AI build out has been funded mostly by internal cash fl ow. But now companies have begun turning to the credit markets for their CapEx fi nancing, which has also contributed to investor queasiness.
In last month’s commentary, I had noted that AI demand had pushed the trading level of the semiconductor industry
into rarefi ed air, and as a result, the implied future volatility of the semiconductor industry has now soared relative to the implied volatility of the S&P 500:
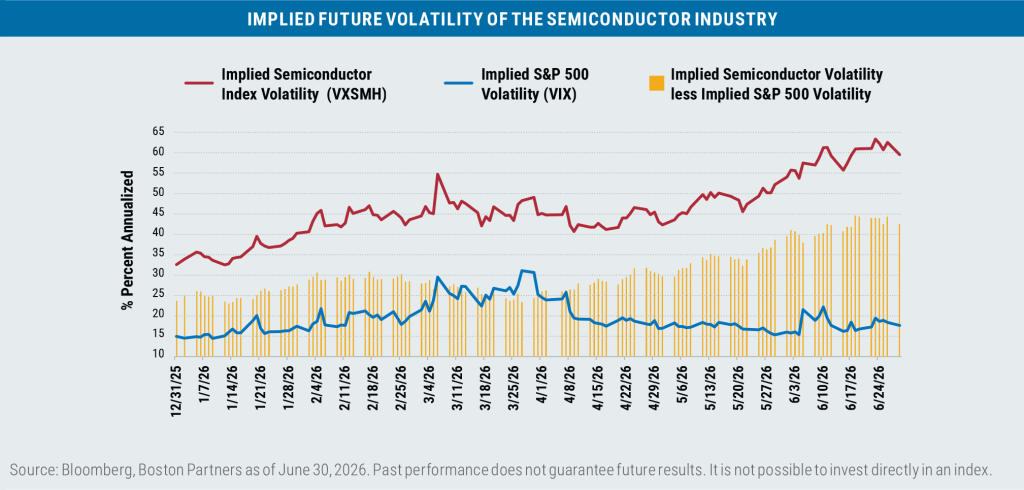
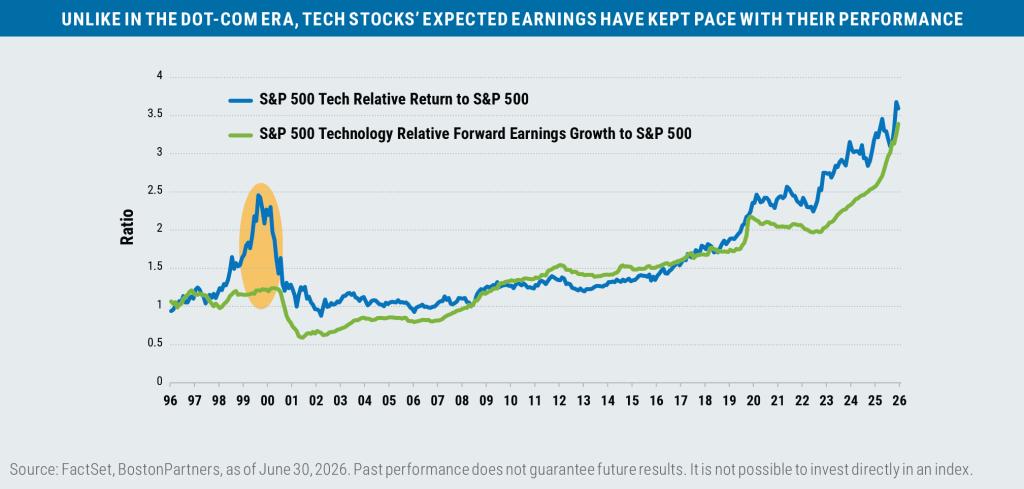
This does not necessarily mean that the performance of Tech as a whole is in danger of a major correction. Prices in the sector continue to be supported by a near equal level of earnings growth, a reality that was notably absent during the Dot-Com Bubble.
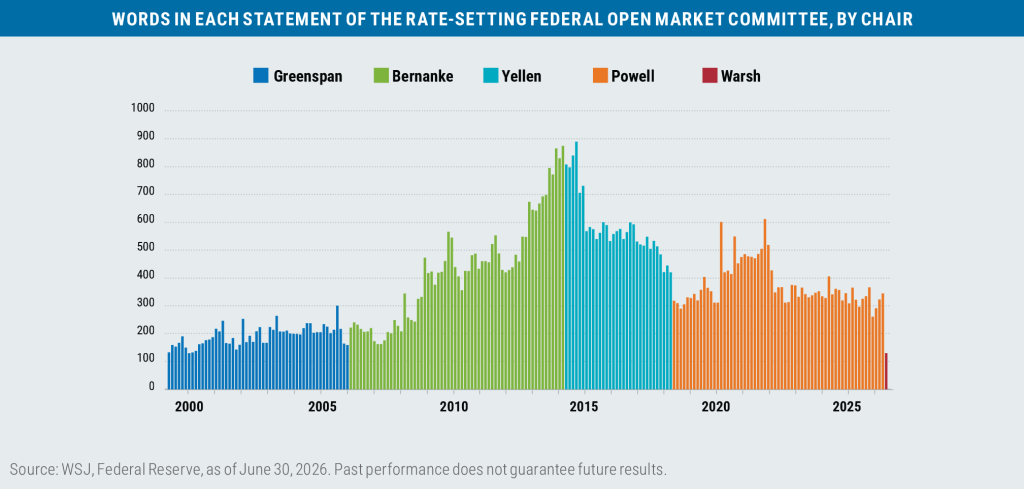
Meanwhile, how investors react to little (or no) forward guidance from the Federal Reserve under Kevin Warsh remains an open question, but the first FOMC post-meeting statement under his stewardship on June 17 contained just 162 words, the fewest since 2007 and well below former chair Jerome Powell’s 397-word average.
Factoid: Under Jerome Powell the average implied volatility of the U.S. Treasury bond market was 81 basis points per year (excluding the COVID dislocations), while under Alan Greenspan (whom Warsh aspires to emulate) it was somewhat higher at 102 basis points.
On the positive side, the reopening of the Strait of Hormuz has been and should continue to be beneficial to headline inflation numbers, which in turn should help to put a lid on Treasury bond yields and offer support to equity price/earnings multiples to keep them near their current levels.
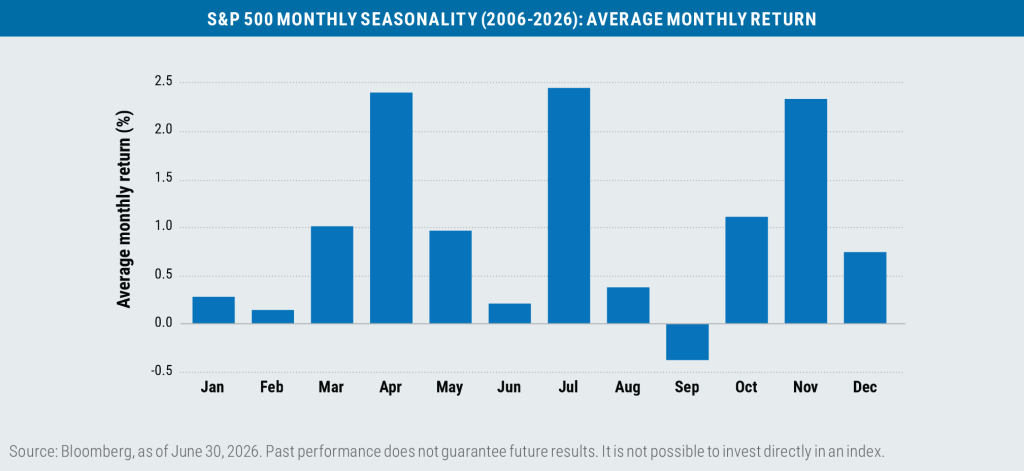
Also, from a seasonality standpoint, July has been the best month of the year for the S&P 500 over the last 20 years,
with equities gaining an average of 2.43%.
Here’s to more of the same. Happy 250th to all!

Boston Partners Global Investors, Inc. (“Boston Partners”) is an investment adviser registered with the SEC under the Investment Advisers Act of 1940. The views expressed in this commentary reflect those of the author as of the date of this commentary. Any such views are subject to change at any time based on market and other conditions and Boston Partners disclaims any responsibility to update such views. Past performance is not an indication of future results.
Discussions of securities, market returns, and trends are not intended to be a forecast of future events or returns. You should not assume that investments in the securities identified and discussed were or will be profitable.
Important information
Beta is a measure of a portfolio’s market risk relative to its benchmark. In general, a beta higher than 1.00 indicates a more volatile portfolio and beta lower than 1.00 indicates a less volatile portfolio in relation to its benchmark. Capital expenditures (CapEx) are investments made by a business to obtain or improve physical assets. The Dot-Com Bubble was a stock market bubble that formed in Internet-related securities during the late 1990s and peaked in early 2000. The Federal Open Market Committee (FOMC) is a rotating group of 12 members of the Federal Reserve system tasked with setting and implementing monetary policy. Comments from the Federal Reserve classified as either dovish or hawkish refers to the underlying stance on monetary policy: A dovish policy prefers lower interest rates to stimulate the economy, while a hawkish policy prefers higher rates to tamp down inflation and/or slow a potentially overheating economy. Implied volatility is a forward-looking measure of anticipated market volatility based on underlying options pricing. Hyperscalers are large-scale data centers used for cloud computing and data management, and can refer to the companies that provide such services. Implied volatility is a forward-looking measure of anticipated market volatility based on underlying options pricing. The Magnificent Seven stocks are a group of high-performing and influential companies in the U.S. stock market: Alphabet, Amazon, Apple, Meta Platforms, Microsoft, Nvidia, and Tesla. West Texas Intermediate (WTI) crude is one of the more easily refined types of oil and serves as a key benchmark for oil prices.
Index definitions
The Bloomberg U.S. Aggregate Bond Index (Agg) tracks the performance of intermediate-term investment-grade bonds traded in the United States. The Bloomberg U.S. Dollar Index (DXY) is used to measure the value of the dollar against a basket of six foreign currencies. The value of the index is a fair indication of the dollar’s value in global markets. The MSCI Emerging Markets (EM) Currency Index tracks the performance of emerging market currencies relative to the
U.S. dollar where the weight of each currency is equal to its country weight in the MSCI Emerging Markets Index. The MSCI EAFE Index tracks the performance of large- and mid-cap equities traded across global developed markets, excluding the United States and Canada. The MSCI Emerging Markets Index tracks the performance of large- and mid-cap equities traded in global emerging markets. The MSCI World ex U.S. Index tracks the performance of large- and mid-cap equities traded across global developed markets, excluding the United States. The Philadelphia Stock Exchange Semiconductor Index (SOX) tracks the capitalization-weighted performance of the 30 largest U.S.-traded companies involved in the design, manufacture, and sale of semiconductors. The Russell 1000 Index tracks the performance of the 1,000 largest companies traded in the United States. The Russell 2000 Index tracks the performance of the 2,000 smallest companies traded in the United States. The Russell 1000 Growth and Value Indexes track the performance of those large-cap U.S. equities in the Russell 1000 Index with growth and value style characteristics, respectively. The Russell 2000 Growth and Value Indexes track the performance of those small-cap U.S. equities in the Russell 2000 Index with growth and value style characteristics, respectively. The Russell Midcap Growth and Value Indexes track the performance of those mid-cap U.S. companies in the Russell 1000 Index with growth and value style characteristics, respectively. The S&P 500 Index tracks the performance of the 500 largest companies traded in the United States. The S&P 500 Equal Weight Index also tracks the performance of the 500 largest companies traded in the United States, but weights each company equally, rather than proportionally according to market cap. S&P credit ratings, which range from AAA (highest) to D (default), are assigned by S&P Global to individual companies to indicate their relative creditworthiness. It is not possible to invest directly in an index.
Market capitalization breakpoints
The breakpoints for capitalization ranges should be viewed only as guideposts and will change over time. In general, FTSE Russell (which maintains a number of stock-market indexes based on company size) considers small-cap stocks to have market caps of between $150 million and $7 billion, mid caps to have market caps between $7 billion and $150 billion, and large caps to be those companies with market caps above $150 billion.
Boston Partners Global Investors, Inc. (Boston Partners) is composed of three divisions, Boston Partners, Boston Partners Private Wealth, and Weiss, Peck & Greer (WPG) Partners, and is an indirect, wholly owned subsidiary of ORIX Corporation of Japan (ORIX).
9019993.1