Mullaney on the Markets
Stocks take a breather
By Michael Mullaney | Director of Global Markets Research
Published December 2025
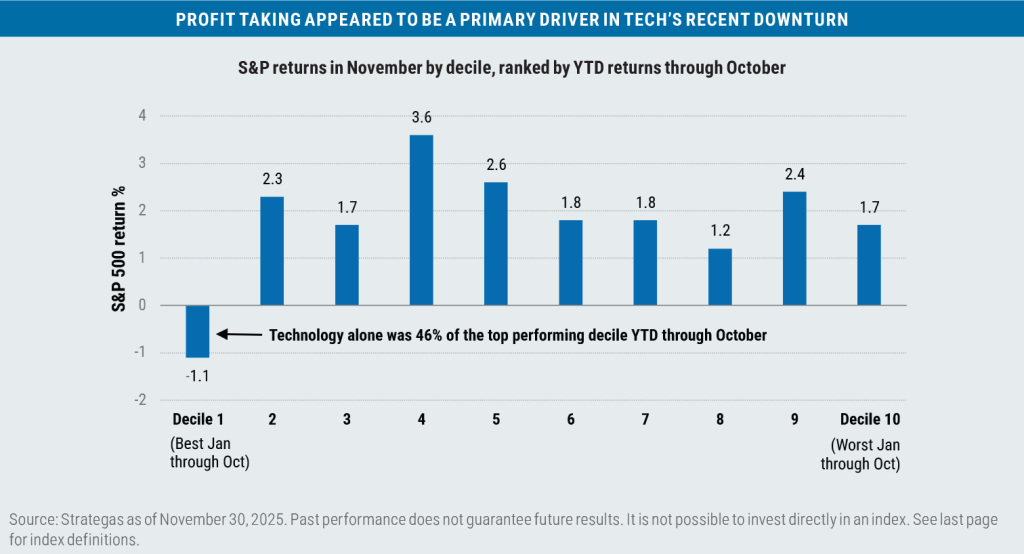
The S&P 500 Index was able to keep its winning streak alive (barely) in November, posting a return of 0.25% for its seventh consecutive monthly gain, a feat that was last accomplished in 1995. The benchmark needed a gain in the final week of the month—and got one of 3.74%—to offset an intra-month pullback of -4.68% that was largely driven by year-end tax loss harvesting in combination with taking gains in year-to-date winners, many of which were names that had traded higher in the artificial intelligence (AI) “arms race.”
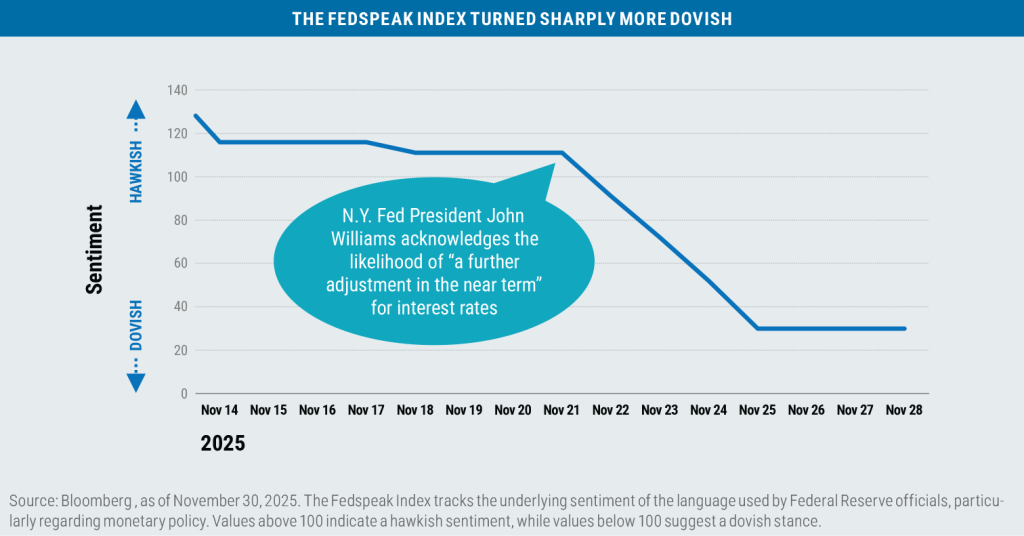
Bonds also produced a positive return for the month with the Bloomberg U.S. Aggregate Bond Index up 0.62%, aided by an average drop in interest rates of seven basis points for Treasuries with maturities ranging from 3 months to 30 years. The biggest decline in rates was at the front end of the yield curve, as the probability of a Fed rate cut during the December meeting rebounded from an intra-month low of 25% to finish the month at 83%, largely due to dovish comments from Fed board members that often referenced the weaker labor market.
For the year the S&P 500 has gained 17.79%, while the Bloomberg U.S. Aggregate Bond Index is up 7.46%.
Sector returns in November: Gains taken and more rotation
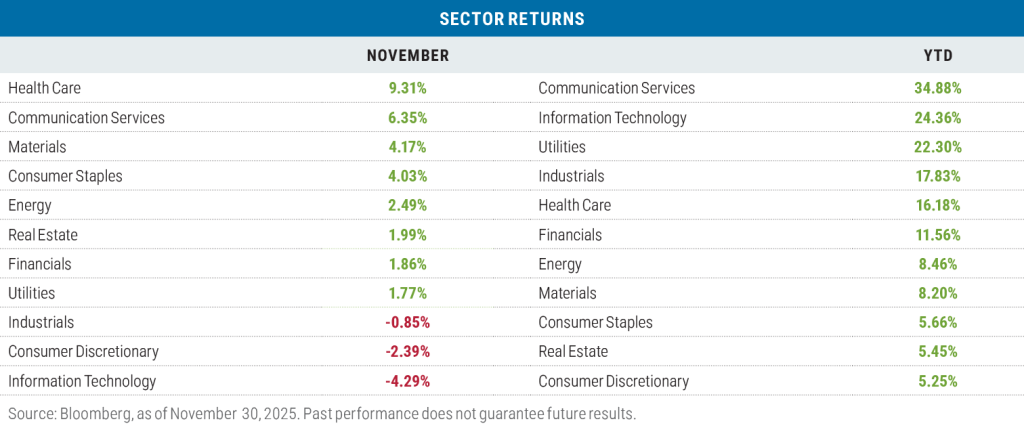
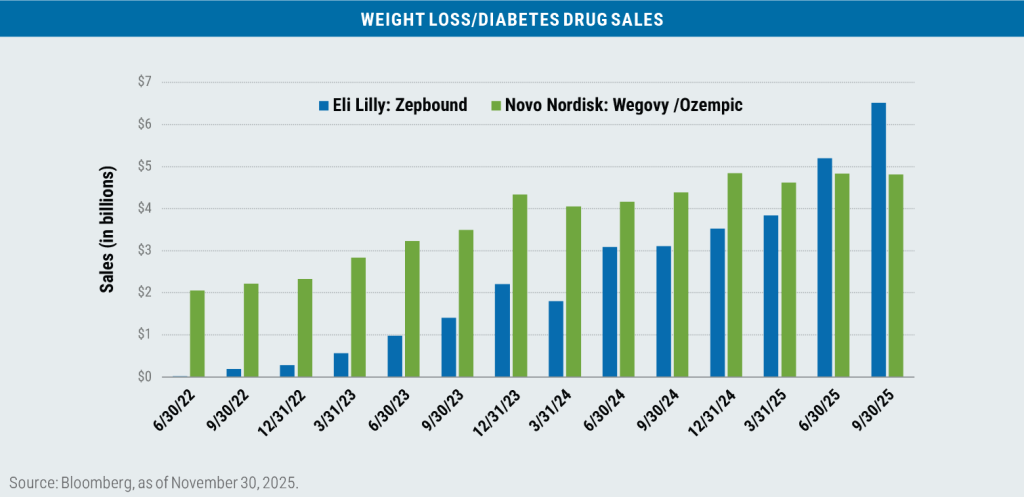
For the second month in a row, we saw strength in the Health Care sector, led primarily by pharmaceutical companies rather than medical device companies or health insurers. Eli Lilly was the top performing stock in the Health Care sector during November with a return of 24.82% and contributed 35% of the sector’s overall return, helped by the success of the company’s Zepbound weight loss drug.
We also saw some weakness in the Information Technology sector as investors began to question the massive amount of AI-related capital expenditures in the segment. At least three significant questions weighed on the sector:
- Will there be an increase in revenues that supersedes the level of spending?
- Will debt financing of CapEx spending become pervasive?
- Will profit margins suffer as a result?
As the leading sector in both October and on a year-to-date basis, these nagging questions left Information Technology as the most susceptible to profit taking in November.

Year to date, Communication Services assumed the pole position in terms of sector leadership, largely on the strength of Google’s parent company Alphabet, which returned 69.23% and contributed to 77% of the overall sector return. In November, Google released an updated version of its AI model, dubbed Gemini 3, that now has 650 million active users compared with ChatGPT’s 800 million. Moreover, Gemini 3 is powered by Google’s own chips, called tensor processing units or TPUs, rather than Nvidia chips. In
November, Meta announced it would begin using Google TPU chips in its data centers beginning in 2027.
The Consumer Discretionary sector was the laggard year to date, hampered by tariff-related cost increases and belt-tightening by consumers as affordability remains an issue, especially for the lower two income quintiles of the population (i.e., the bottom 40%).
In November, investors rotated into value
During the month, value beat growth by an average of 4.16% when measured across the three major capitalization ranges, the biggest return differential for value since July 2024.
The Information Technology sector was responsible for the bulk (39%) of the large-cap value outperformance, albeit by losing less than large-cap growth in the sector (Russell 1000 Value Tech: –1.94%; Russell 1000 Growth Tech: –5.04%).
In mid caps, it was much the same story: The tech sector in the Russell Midcap Value Index returned –3.12% for the month versus –10.61% for the sector in the Russell Midcap Growth Index, which accounted for 31% of the performance differential in November.
In small caps, the outperformance of the Russell 2000 Value Index was more nuanced, though the 5.17% return for Financials—with a weight of 26% in the index—versus the 1.77% return and only a 9% weighting for the Russell 2000 Growth Index was a significant contributor.
Year to date, the outperformance of growth versus value has shrunk to just 1.80% when averaged across the three capitalization ranges. Through October, that return differential was 6.47% in favor of growth; in fact, mid-cap value now leads mid-cap growth on a year-to-date basis.
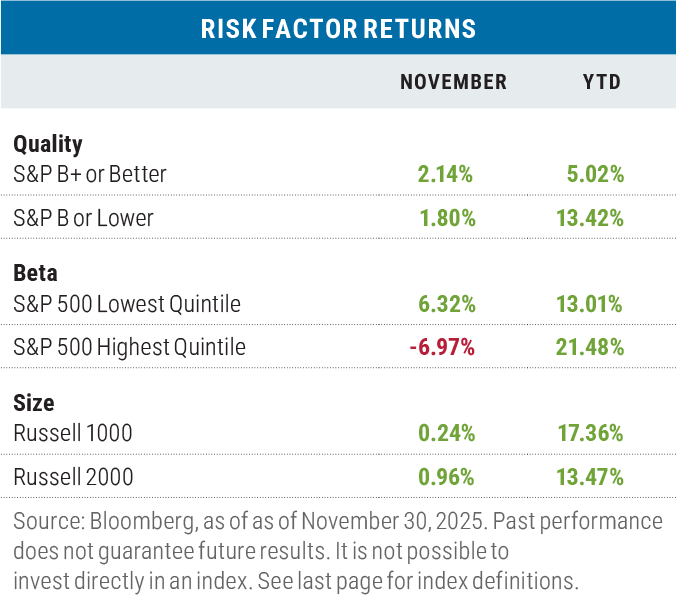
A risk reversal in November
“Risk off” was the major theme in November as high-quality stocks beat low quality and low-beta names outperformed high-beta ones. While the Russell 2000 Index of small-cap stocks outperformed the large-cap Russell 1000 Index by 72 basis points, that was largely due to the profit taking on tech stocks in the large-cap benchmark.
Year to date, “risk on” characteristics still dominate returns except for the size factor, where large-cap stocks continue to lead their riskier small-cap counterparts thanks to the performance of mega-cap tech stocks.
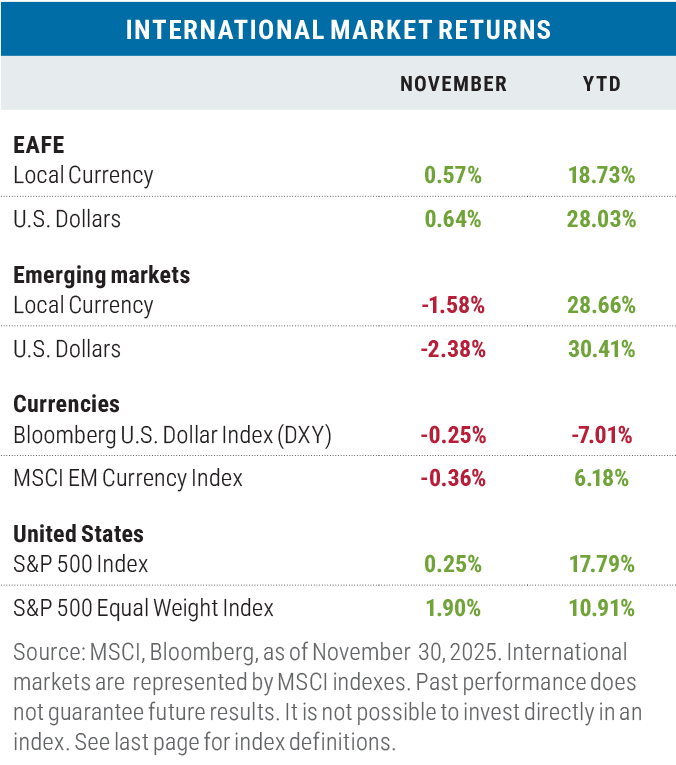
The EAFE Index of developed market international stocks slightly outperformed the S&P 500 in November in both local currency and U.S. dollar (USD) terms, but in keeping with the risk off theme that was prevalent during the month, emerging market stocks lagged U.S. equities—more so in dollar terms given the weakness in emerging market currencies. OPEC countries were particularly hard hit (Saudi Arabia, for example, was down 8.35% in USD) as the price of crude oil fell from $65.07 per barrel to $63.20 during the month on oversupply concerns.
Year to date, both developed and emerging markets have outperformed most domestic stock benchmarks. For U.S.-based investors that have diversified outside their home market, the drop in the U.S. dollar over the year has served as a tailwind for returns via foreign currency gains.
Looking ahead
There are at least three factors that should support higher stock prices going forward, at least for the S&P 500 over the
near term:
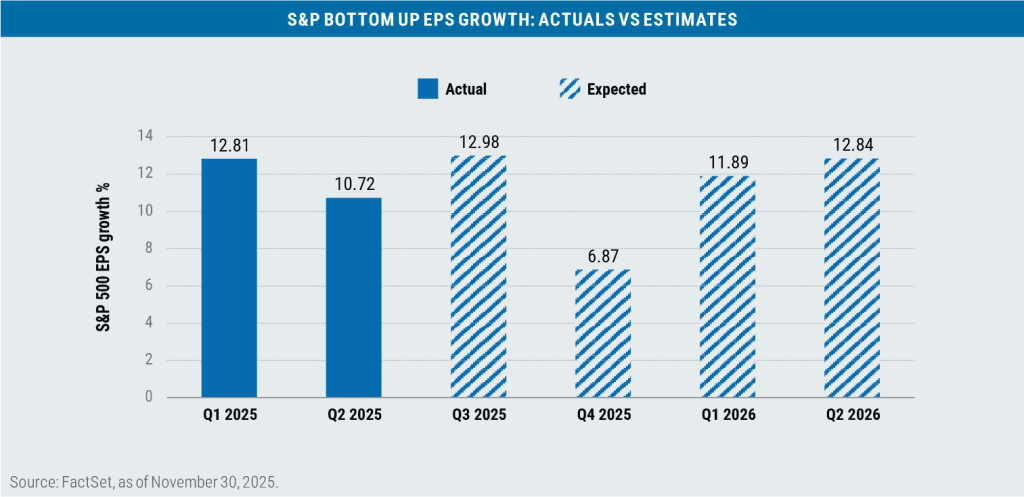
- Earnings per share (EPS) growth
- Interest rates
- Seasonal pricing patterns
In terms of EPS growth, while Q4 expectations are on the soft side for the S&P 500, they are still remain positive and are poised to accelerate again in Q1 & Q2 next year.
As for interest rates, investors currently foresee up to four additional rate cuts by the Federal Reserve in 2026 as part of an expected effort to maintain a steady labor force and in anticipation of continued improvement on the inflation front.
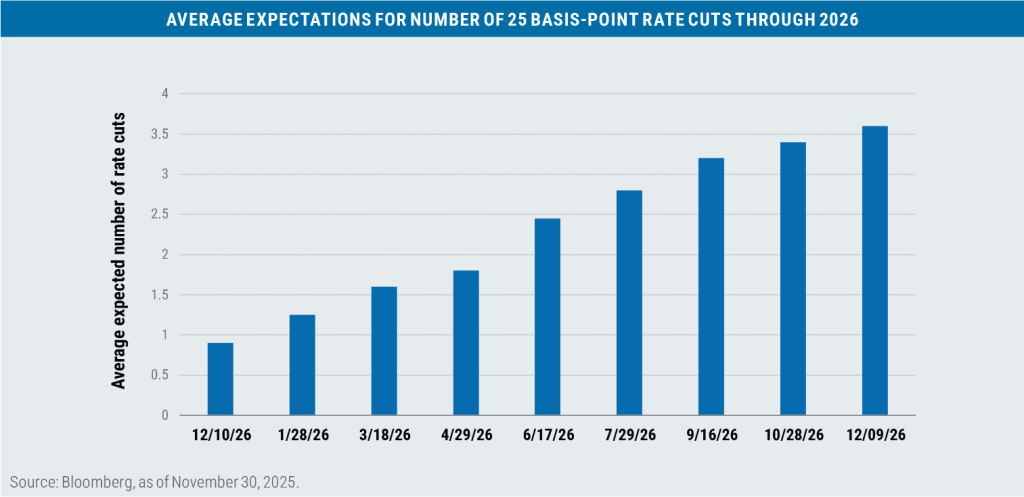
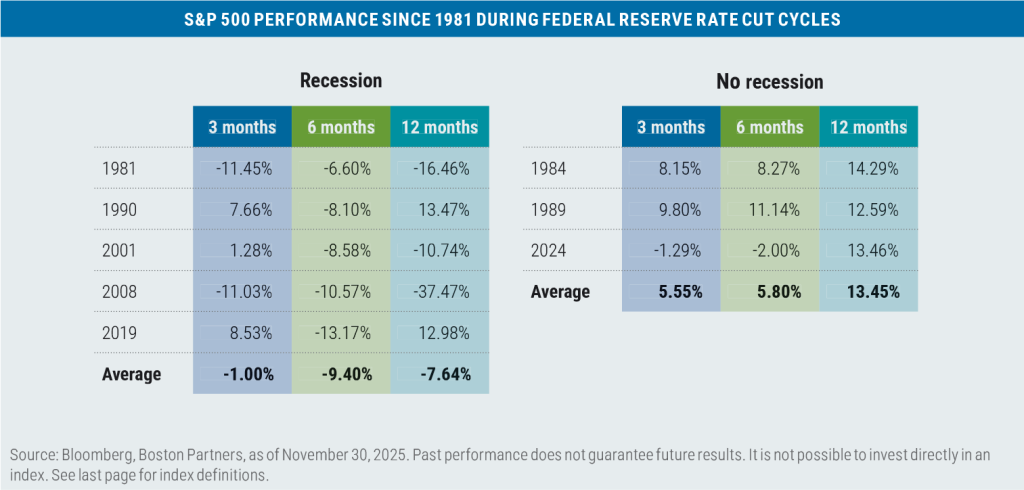
As we’ve highlighted before, Fed easing cycles have been a positive for S&P 500 returns as long as a recession is avoided.
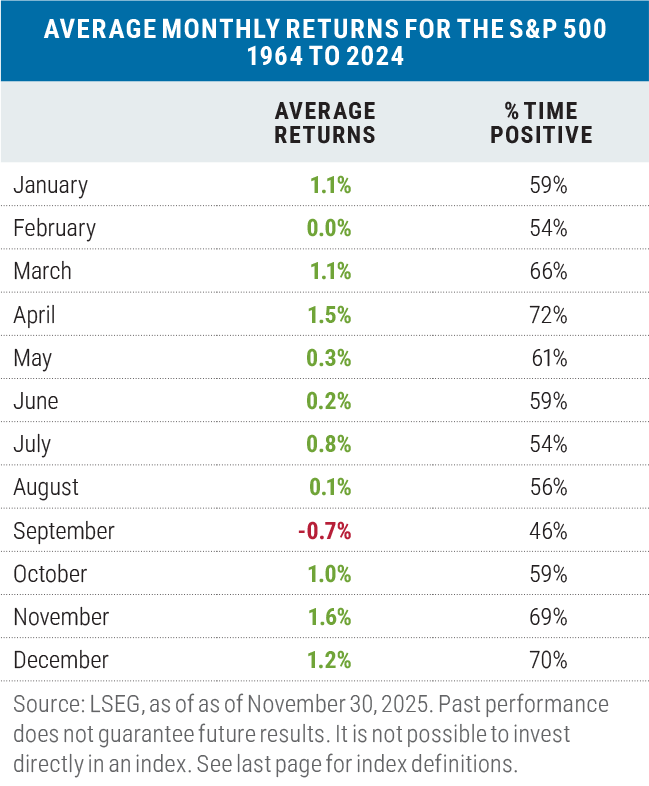
Finally, the seasonal performance pattern for the S&P 500 is also favorable over the near term with what have historically been some of the best months of the year occurring between December and April.
A note of caution
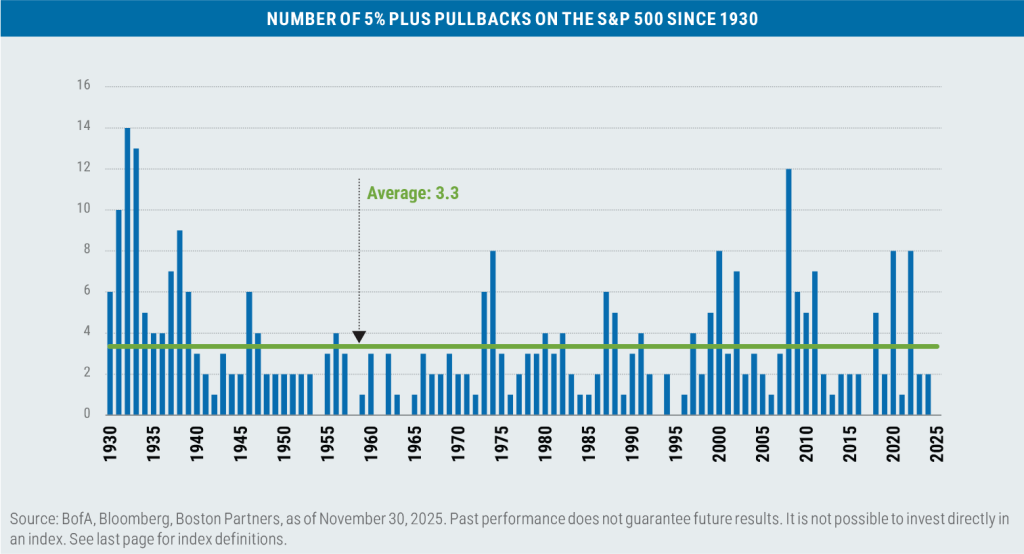
While there are no obvious near-term warning signs* for the stock market that are readily observable in our crystal ball, we remain wary that a pullback in stock prices (5% or more) can happen at almost any time—and historically, has happened on average 3.3 times a year, or roughly every 110 days. Despite the seven-month winning streak—or perhaps because of it—investors shouldn’t get too accustomed the market moving in only one direction.
* Valuation is a lousy short-term performance indicator.

Boston Partners Global Investors, Inc. (“Boston Partners”) is an investment adviser registered with the SEC under the Investment Advisers Act of 1940. The views expressed in this commentary reflect those of the author as of the date of this commentary. Any such views are subject to change at any time based on market and other conditions and Boston Partners disclaims any responsibility to update such views. Past performance is not an indication of future results.
Discussions of securities, market returns, and trends are not intended to be a forecast of future events or returns. You should not assume that investments in the securities identified and discussed were or will be profitable.
Terms and definitions
The AI “arms race” refers to the accelerated pace of capital expenditures currently under way among AI providers and other large technology companies. A basis point refers to a common unit of measure for interest rates and other percentages in finance. One basis point is equal to 1/100th of 1%, or 0.01%. Beta is a measure of a portfolio’s market risk relative to its benchmark. In general, a beta higher than 1.00 indicates a more volatile portfolio and beta lower than 1.00 indicates a less volatile portfolio in relation to its benchmark. The Bloomberg U.S. Aggregate Bond Index tracks the performance of intermediate-term investment-grade bonds traded in the United States. The Bloomberg U.S. Dollar Index (DXY) is used to measure the value of the dollar against a basket of six foreign currencies. The value of the index is a fair indication of the dollar’s value in global markets. Comments from the Federal Reserve classified as either dovish or hawkish refers to the underlying stance on monetary policy: A dovish policy prefers lower interest rates to stimulate the economy, while a hawkish policy prefers higher rates to tamp down inflation and/or slow a potentially overheating economy. Earnings per share (EPS) reflects a company’s total earnings divided by the total number of shares outstanding. Blended EPS combines historical (i.e., actual) earnings with earnings expectations and is often used to assess a group of companies that may be in different stages of their earnings reporting cycle. The MSCI Emerging Markets (EM) Currency Index tracks the performance of emerging market currencies relative to the U.S. dollar where the weight of each currency is equal to its country weight in the MSCI Emerging Markets Index. The MSCI EAFE Index tracks the performance of large- and mid-cap equities traded across global developed markets, excluding the United States and Canada. The MSCI Emerging Markets Index tracks the performance of large- and mid-cap equities traded in global emerging markets. The Organization of the Petroleum Exporting Countries (OPEC) is an alliance of 12 oil-producing and exporting countries designed to influence the global supply of petroleum and maximize profits. The Russell 1000 Index tracks the performance of the 1,000 largest companies traded in the United States. The Russell 2000 Index tracks the performance of the 2,000 smallest companies traded in the United States. The Russell 1000 Growth and Value Indexes track the performance of those large-cap U.S. equities in the Russell 1000 Index with growth and value style characteristics, respectively. The Russell 2000 Growth and Value Indexes track the performance of those small-cap U.S. equities in the Russell 2000 Index with growth and value style characteristics, respectively. The Russell Midcap Growth and Value Indexes track the performance of those mid-cap U.S. companies in the Russell 1000 Index with growth and value style characteristics, respectively. The S&P 500 Index tracks the performance of the 500 largest companies traded in the United States. The S&P 500 Equal Weight Index also tracks the performance of the 500 largest companies traded in the United States, but weights each company equally, rather than proportionally according to market cap. S&P credit ratings, which range from AAA (highest) to D (default), are assigned by S&P Global to individual companies to indicate their relative creditworthiness. Tax loss harvesting is a strategy where investors sell securities that have lost value to offset capital gains from other investments, thereby reducing their overall tax liability. It is not possible to invest directly in an index.
Market capitalization breakpoints
The breakpoints for capitalization ranges should be viewed only as guideposts and will change over time. In general, FTSE Russell (which maintains a number of stock-market indexes based on company size) considers small-cap stocks to have market caps of between $150 million and $7 billion, mid caps to have market caps between $7 billion and $150 billion, and large caps to be those companies with market caps above $150 billion.
Boston Partners Global Investors, Inc. (Boston Partners) is composed of three divisions, Boston Partners, Boston Partners Private Wealth, and Weiss, Peck & Greer (WPG) Partners, and is an indirect, wholly owned subsidiary of ORIX Corporation of Japan (ORIX).
8587568.1