Mullaney on the Markets
Shifting sands
By Michael Mullaney | Director of Global Markets Research
Published November 2026
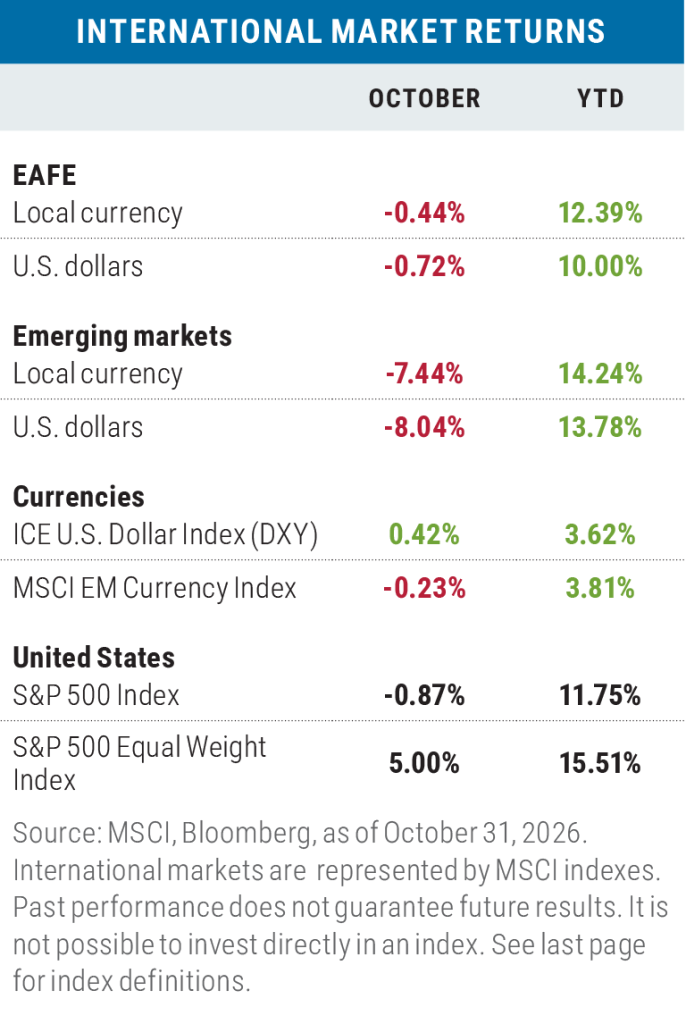
For the period ended October 31, 2026, domestic stock returns varied significantly, with the capitalization-weighted S&P 500 drop-ping by 0.87%, but the equal-weighted version of the benchmark gaining 5.00%, the largest performance discrepancy favoring the Equal-Weighted S&P 500 since April 2009. Likewise, the Magnificent Seven fell by 4.67%, while the S&P 493 gained 1.34%. The tech-laden Nasdaq 100 was particularly hard hit, falling by 6.63% as concerns about monetizing the artificial intelligence (AI) buildout took hold.
Bonds gained ground during the swift rotation away from tech, with the Bloomberg U.S. Aggregate Bond Index returning 2.44% as investors sought a safe haven. It was the best monthly return for the bond benchmark since December 2023.
Year-to-date results through October, while positive, followed a similar pattern, with the S&P 500 up by 11.75%, the S&P 500 Equal Weight Index up 15.51%, the Magnificent 7 up 4.08%, and the S&P 493 up 14.56%; the Nasdaq 100, meanwhile, was up 12.98%. Bonds remained in the red, with the Bloomberg U.S. Aggregate Bond Index down 0.54% as inflation con-tinued to show little progress in easing towards the Federal Reserve’s 2% target.
Sector returns
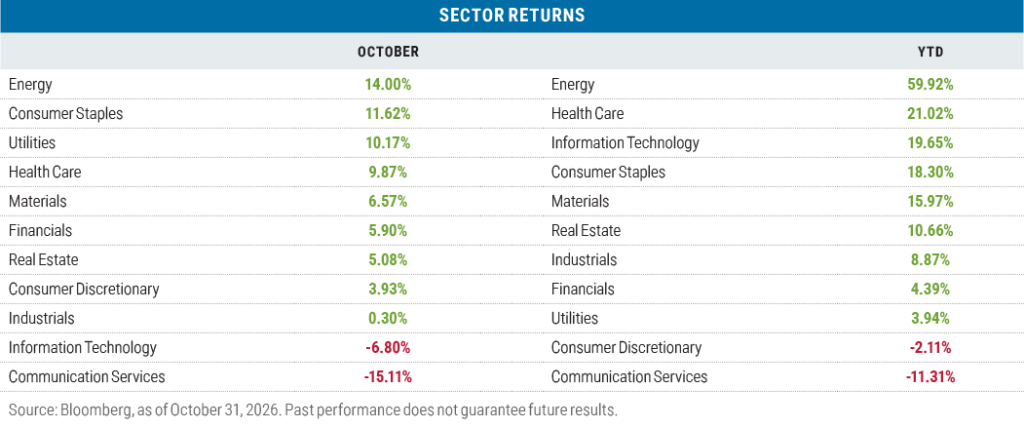
The Energy sector regained top billing for returns in October as the continuation of the war in Iran and threats of a further escalation after the midterm elections led to a spike in the price of oil, sending West Texas Intermediate from $88.42 to $104.12 during the month and Brent crude from $97.66 to $111.73. Year-over-year profits for the third quarter soared for oil giants like ExxonMobil (earnings per share up 104%) and Chevron (EPS up 277%).
The Consumer Staples sector produced its best monthly return since October 2000 as investors gravitated towards historically defensive sectors including not just Staples, but also Utilities and Health Care.
Communication Services was the clear-cut laggard for the month as AI capital expenditures for Alphabet and Meta Platforms failed to show any discernible effect in growing revenues. Alphabet, which accounts for 56% of the sector, fell 18.53% during the month, while Meta, which accounts for another 24% of the sector, dropped by 15.19%. Together they were responsible for 94% of the sector’s loss during October.
Year to date, the Energy sector remains in the pole position, while the more defensive Health Care sector crept into second place. Eli Lilly, which accounts for 15% of the overall Health Care sector’s weight, was responsible for 23% of the sector’s return with a year-to-date gain of 32.54%, largely on the strength of the company’s GLP-1 drug franchise success.
Given its weakness in October, Communication Services has fallen into last place among all sectors for the year.
Style returns
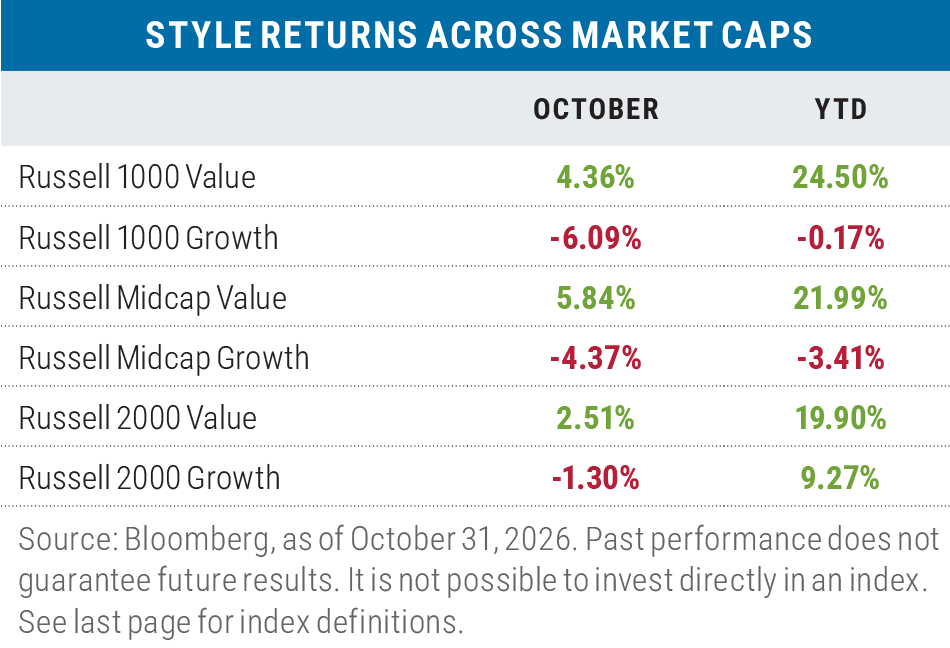
Value led growth by an average of 8.16% in October across the three major Russell capitalization ranges. It was the best single-month performance of value versus growth on a collective basis since the bursting of the Dot-Com Bubble in March 2001. Likewise, the year-to-date average outperformance of value versus growth, at 20.23%, was also the best since 2001.
Risk off was predominant in October, while risk on leads year to date
October brought back the risk-off trade, seeing high-quality and low-beta stocks outperform, while small size led large primarily due to the negative effect of Big Tech; while the losses for the Technology sector were similar between the two indexes (Russell 1000: -6.77%; Russell 2000: -5.24%), the Russell 1000 has nearly triple the weight in Technology versus the Russell 2000 (37.1% vs 13.4%).
The year-to-date story has been something of a mixed bag, with low-beta stocks significantly outperforming high beta, while low-quality stocks have outperformed their higher-quality counterparts. On the size front, small caps have so far edged out large, but by a narrower margin.
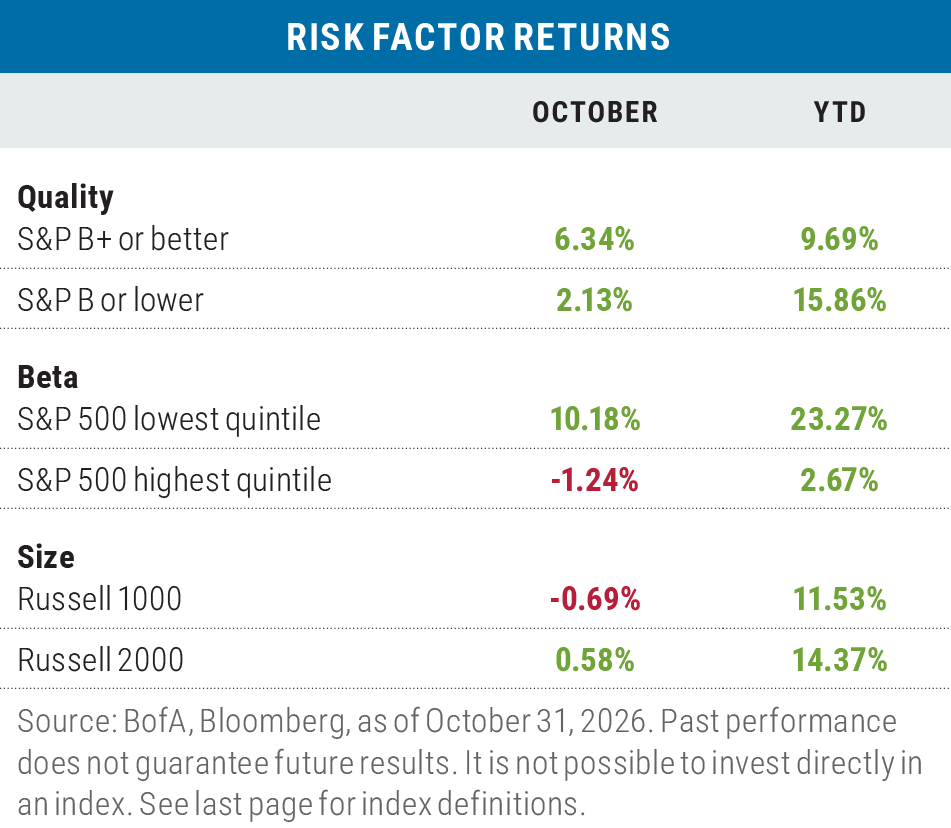
Given their strength earlier in the year, the three risk-on factors have continued to prevail on a year-to-date basis.
Developed markets lose less in October, as EM got pummeled
Developed-market international stocks (as measured by the MSCI EAFE Index) sneaked past the S&P 500 in October in both local currency and dollar terms, though only on a capitalization-weighted basis. Returns for the EAFE in U.S.-dollar (USD) terms were lower due to the appreciation of the dollar during the month, as measured by the ICE U.S. Dollar Index (DXY).
In local currencies, developed-market stocks continued to maintain their lead on the cap-weighted S&P 500 through October, though they lag the S&P in dollar terms given the appreciation of the DXY.
Emerging-market stocks were hurt by the losses in South Korea (down 15.57%) and Taiwan (down 8.37%) due to their concentrated exposure to three stocks: Samsung (down 15.00%) and SK Hynix (down 19.01%) in South Korea, and Taiwan Semiconductor (down 6.69%) in Taiwan.
Brazil was also a significant drag on EM performance after falling by 12.11% on the surprise re-election of leftwing leader Luiz Inácio Lula da Silva (Lula), who secured a historic fourth term as President of Brazil, defeating far-right Senator Flávio Bolsonaro, who entered the election with nearly 80% odds of winning according to the prediction markets.
Year to date, EM continues to lead the S&P 500 in both local currency and USD terms, largely due to the earlier hefty returns generated in South Korea and Taiwan.
Looking ahead
This month I purposely held off finishing my commentary until after the midterm elections on November 3, hoping to provide some preliminary insights into the outcome. First, while going into the election there was a lot of chatter about a Blue Wave, as the night progressed and votes continued to be tallied, that wave grew into a “Blue Tsunami” (or “Bluenami,” as commentators dubbed it); the Democratic Party gained ground in a historic fashion, retaking control of the House of Representatives, the Senate, and almost all of the closely contested govenors’ seats that were up for grabs. Here’s how the result stacked up versus previous midterms:
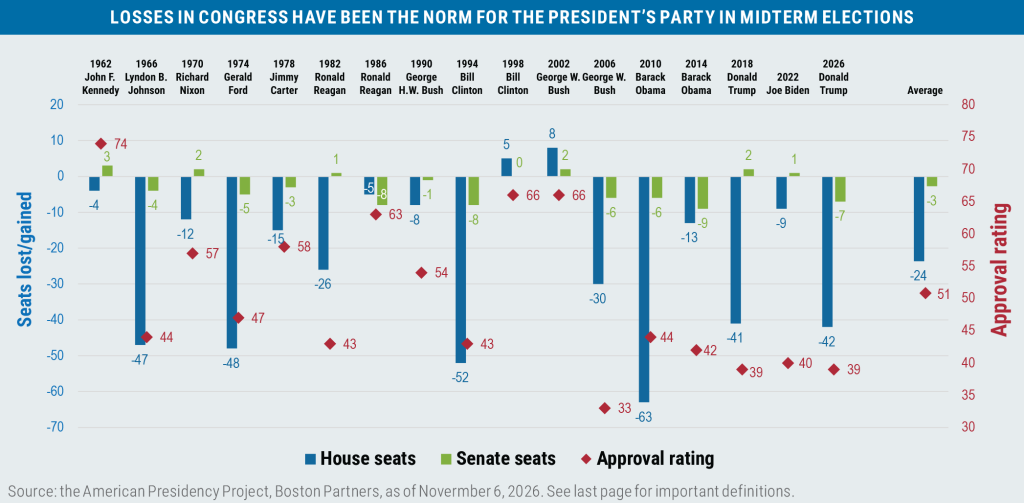
What happens over the next two years remains to be seen as President Trump retains the ability to execute executive orders and his veto power, while Democrats will certainly strive to address the top concern of voters—namely inflation and affordability—through legislative actions and the budgeting process.
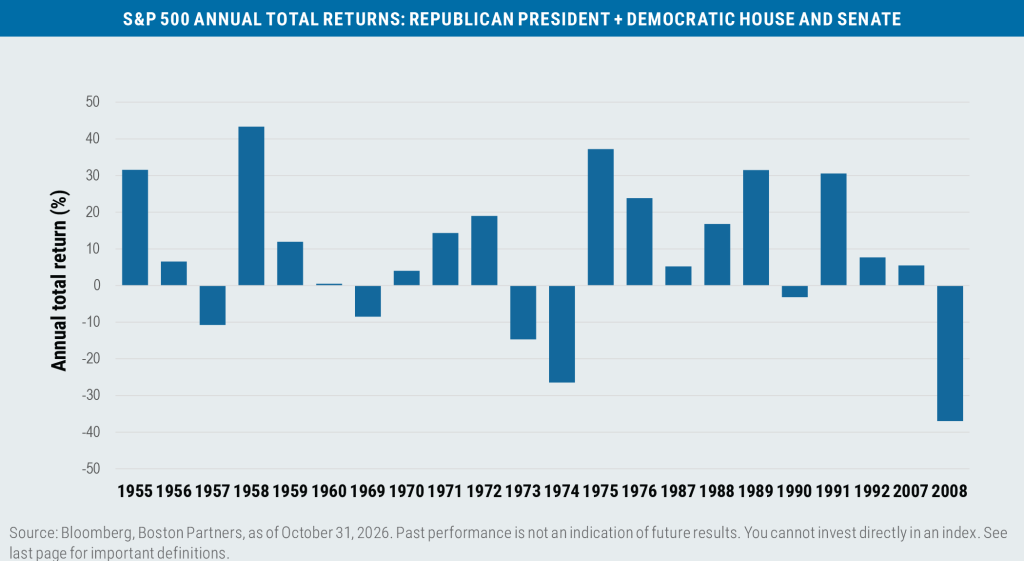
Historically, a federal government comprising a Republican President and Democratic majorities in both chambers of Congress has not necessarily been an impediment to stock returns: During the 22 years that the federal government had this particular political configuration, the S&P 500 had a positive return 73% of the time and an average return of 8.57%.
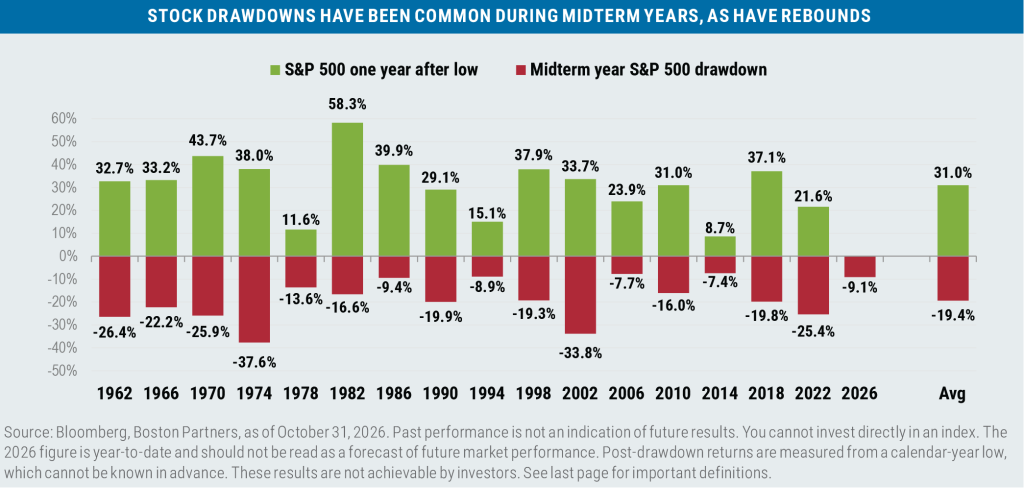
It has not always been a straight line for returns, though, as during midterm election years going back to 1962, the S&P 500 has always experienced a drawdown, usually followed by a fairly signifi cant rally off those lows.
Stock returns were also positive one year after the last two times that both chambers of Congress flipped during a midterm election year: In 1994 under President Clinton, Congress flipped from Democratic to Republican, and in 2006 under President George W. Bush, Congress flipped from Republican to Democratic.
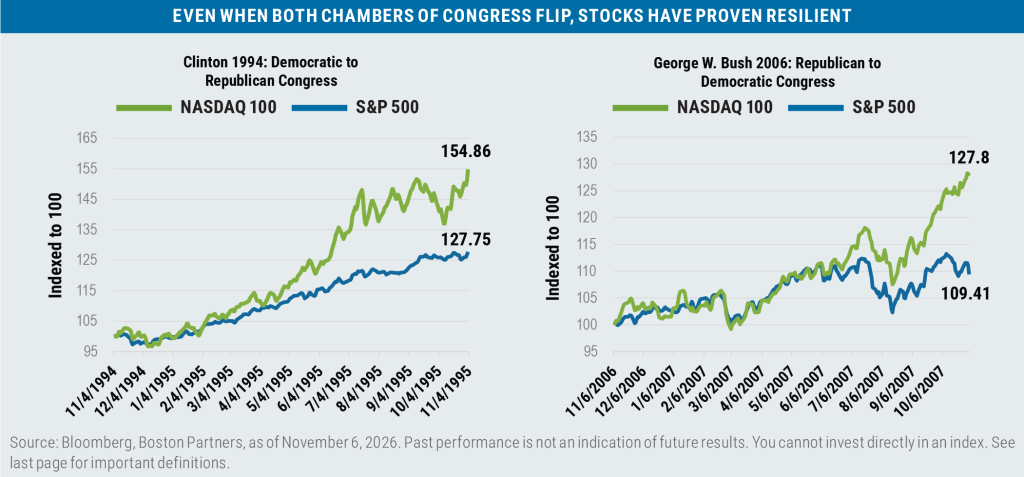
Note that in both instances, Big Tech (as measured by the Nasdaq 100 Index) went on to handily outperform the S&P 500.
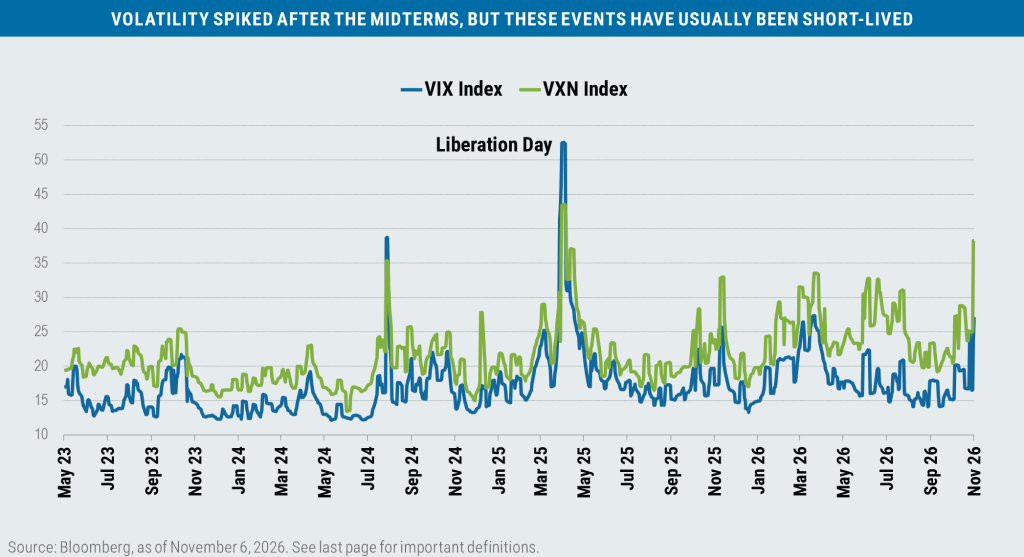
The stock market’s reaction to the results of the latest midterm elections has been pretty dramatic in terms of the change to implied volatility, both for the VIX Index (which measures the implied volatility of the S&P 500 over the next 30 days) and the VXN Index, its Nasdaq 100 Index counterpart.
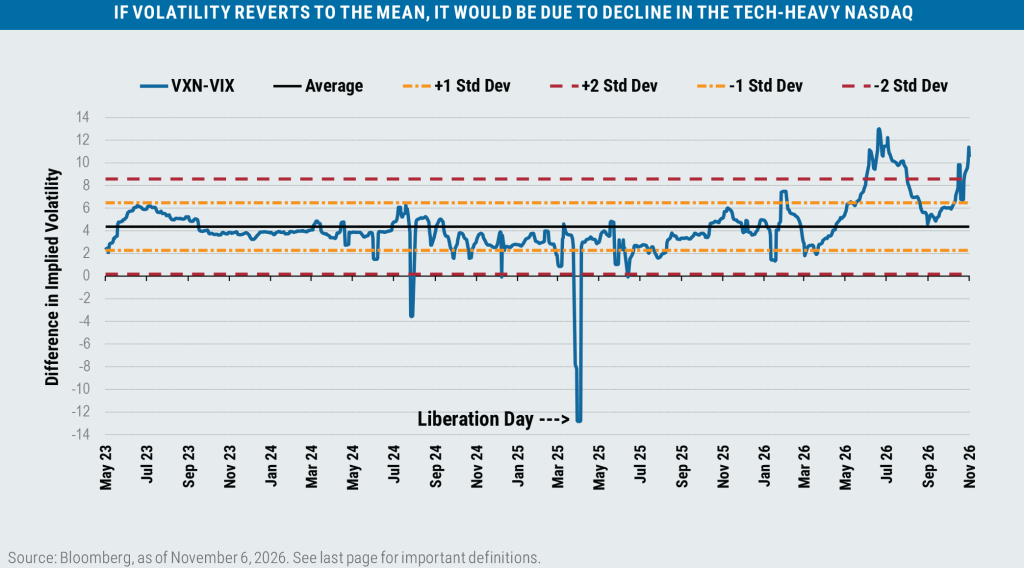
Historically, the difference between the two measures has tended to fairly quickly revert to the mean after reaching the relatively extreme levels we’re currently experiencing.
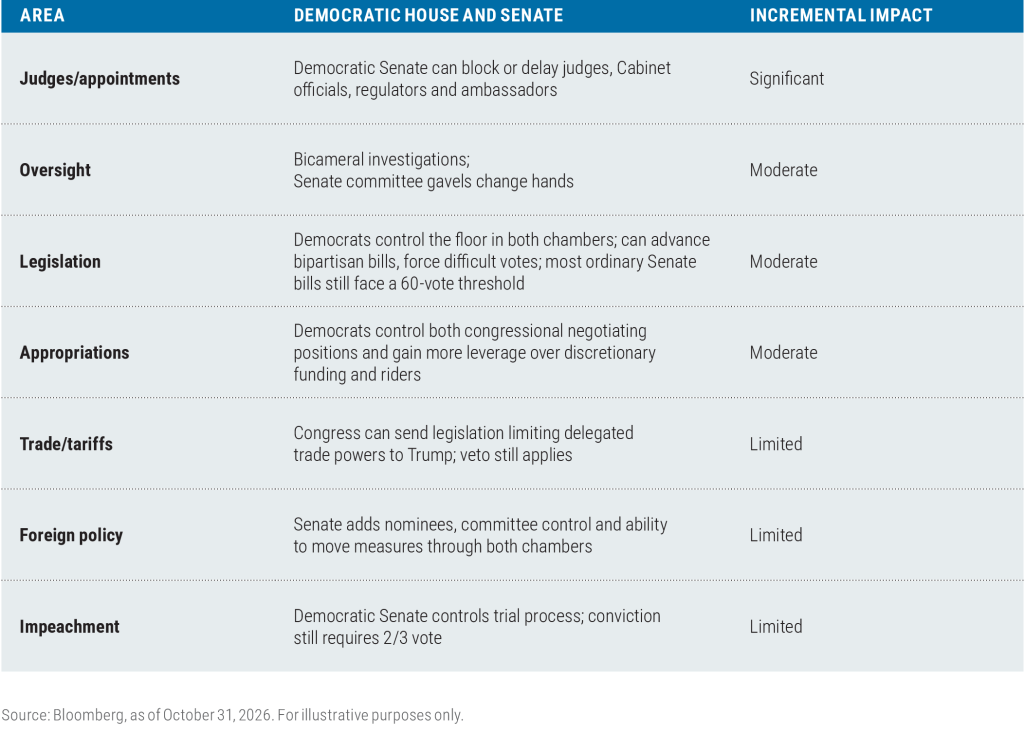
Lastly, from the economics team at Bloomberg, here’s a quick snapshot of those areas where a Democrat-controlled Congress could have the biggest impact. How this shakes out in 2027 and beyond remains to be seen. But we’ll be watching closely.

Boston Partners Global Investors, Inc. (“Boston Partners”) is an investment adviser registered with the SEC under the Investment Advisers Act of 1940. The views expressed in this commentary reflect those of the author as of the date of this commentary. Any such views are subject to change at any time based on market and other conditions and Boston Partners disclaims any responsibility to update such views. Past performance is not an indication of future results.
Discussions of securities, market returns, and trends are not intended to be a forecast of future events or returns. You should not assume that investments in the securities identified and discussed were or will be profitable.
Important information
Beta is a measure of a portfolio’s market risk relative to its benchmark. In general, a beta higher than 1.00 indicates a more volatile portfolio and beta lower than 1.00 indicates a less volatile portfolio in relation to its benchmark. Brent crude and West Texas Intermediate (WTI) crude are two types of more easily refined oil and serve as key benchmarks for oil prices. The Dot-Com Bubble was a stock market bubble that formed in Internet-related securities during the late 1990s and peaked in early 2000. The Magnificent Seven stocks are a group of high-performing and influential companies in the U.S. stock market: Alphabet, Amazon, Apple, Meta Platforms, Microsoft, Nvidia, and Tesla.
Index definitions
The Bloomberg U.S. Aggregate Bond Index (Agg) tracks the performance of intermediate-term investment-grade bonds traded in the United States. The ICE U.S. Dollar Index (DXY) is used to measure the value of the dollar against a basket of six foreign currencies. The value of the index is a fair indication of the dollar’s value in global markets. The MSCI Emerging Markets (EM) Currency Index tracks the performance of emerging market currencies relative to the U.S. dollar where the weight of each currency is equal to its country weight in the MSCI Emerging Markets Index. The MSCI EAFE Index tracks the performance of large- and mid-cap equities traded across global developed markets, excluding the United States and Canada. The MSCI Emerging Markets Index tracks the performance of large- and mid-cap equities traded in global emerging markets. The Nasdaq 100 tracks 100 of the largest non-financial companies listed on the Nasdaq stock exchange. The Russell 1000 Index tracks the performance of the 1,000 largest companies traded in the United States. The Russell 2000 Index tracks the performance of 2,000 of the smallest companies traded in the United States. The Russell 1000 Growth and Value Indexes track the performance of those large-cap U.S. equities in the Russell 1000 Index with growth and value style characteristics, respectively. The Russell 2000 Growth and Value Indexes track the performance of those small-cap U.S. equities in the Russell 2000 Index with growth and value style characteristics, respectively. The Russell Midcap Growth and Value Indexes track the performance of those mid-cap U.S. companies in the Russell 1000 Index with growth and value style characteristics, respectively. The S&P 500 Index tracks the performance of the 500 largest companies traded in the United States. The S&P 500 Equal Weight Index also tracks the performance of the 500 largest companies traded in the United States, but weights each company equally, rather than proportionally according to market cap. The S&P 493 is not an official index, but reflects the performance of the S&P 500 excluding the Magnificent Seven. S&P credit ratings, which range from AAA (highest) to D (default), are assigned by S&P Global to individual companies to indicate their relative creditworthiness. The VIX, or Cboe Volatility Index, tracks expectations for future volatility of the stock market based on the prices of underlying S&P 500 Index options. The VXN, or Cboe Nasdaq-100 Volatility Index, tracks expectations for future volatility of the stock market based on the prices of underlying Nasdaq 100 Index options. It is not possible to invest directly in an index.
Market capitalization breakpoints
The breakpoints for capitalization ranges should be viewed only as guideposts and will change over time. In general, small-cap stocks are considered to have market caps of between $150 million and $7 billion, mid caps to have market caps between $7 billion and $50 billion, and large caps to be those companies with market caps above $50 billion.
Boston Partners Global Investors, Inc. (Boston Partners) is composed of three divisions, Boston Partners, Boston Partners Private Wealth, and Weiss, Peck & Greer (WPG) Partners, and is an indirect, wholly owned subsidiary of ORIX Corporation of Japan (ORIX).
9019993.4