Mullaney on the Markets
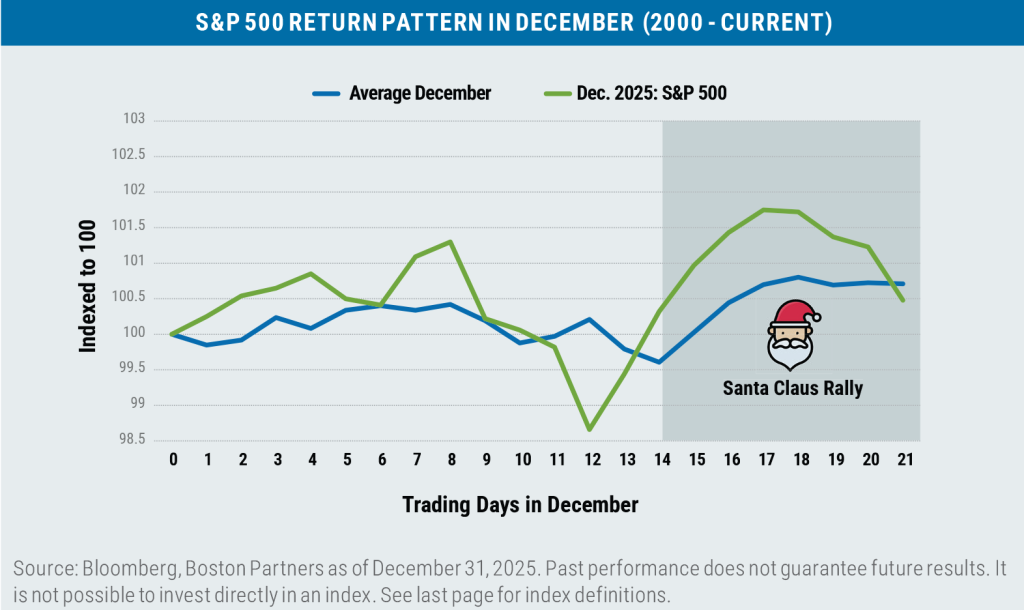
Santa delivers the goods
By Michael Mullaney | Director of Global Markets Research
Published January 2026
While not your classic Santa Claus Rally—which, according to the Stock Trader’s Almanac, occurs when the S&P 500 produces a gain for the last five days of December plus the first two trading days of January—the S&P 500 was able to rebound from a monthly loss of 1.78% as of the middle of December to finish with a gain of 0.06% by the end of the month thanks to a series of positive daily returns during the final two weeks. The S&P 500 has now produced eight consecutive months of gains, a feat that has only been accomplished one other time in the last 35 years.
Bonds did not follow suit as the Bloomberg U.S. Aggregate Bond Index of Treasury, mortgage, and investment-grade corporate bonds dropped by 0.15% during December, largely due to a “hawkish cut” by the Federal Reserve during the month and a surprisingly strong Q3 GDP report that stoked inflation fears. While short-term rates declined on the Fed rate cut, the yield on longer maturity bonds actually increased, leading to a loss of 1.85% for securities in the index with maturities of 15 years and longer.
For the fourth quarter, the S&P 500 gained 2.65% while the Bloomberg U.S. Aggregate Bond Index returned 1.10%; for the year, the S&P advanced by 17.86% while the Agg gained 7.30%.
Sector returns in December: More losers than winners
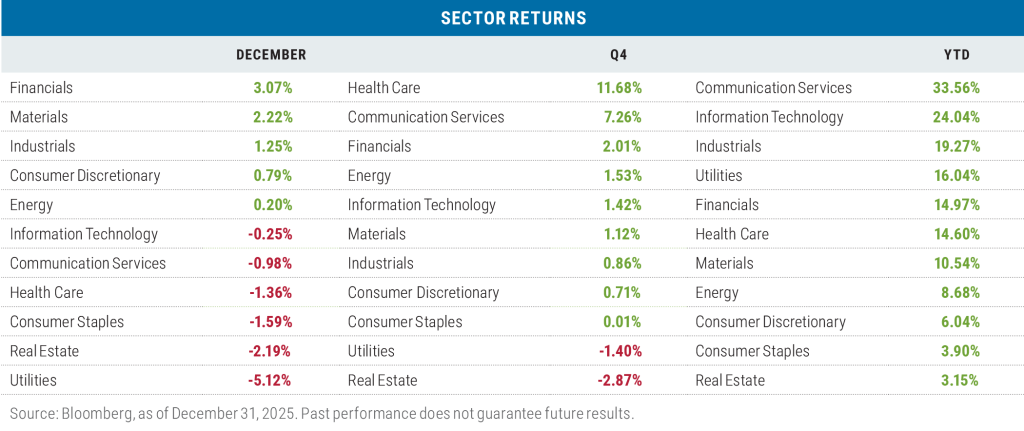
The strength of the Q3 GDP report helped cyclical stock sectors do well in December, led by Financials. The sector also benefited from the steepening of the Treasury yield curve as short rates dropped and long rates rose; the spread between 3-month T-Bills and 30-year Treasury bonds rose from 86 basis points to 121 basis points during the month. Higher absolute rates and a steeper yield curve have historically proven to be a catalyst for boosting profit margins at banks.
Utilities, which had been the third-best performing sector through November, fell the most in December on profit-taking and mounting fears that power generation companies would not be able to keep pace with the almost insatiable electricity demand required by current and forthcoming artificial intelligence (AI) data centers. The losses in the sector were broad-based, as only four of the thirty-one stocks in the segment posted a positive return for the month.
While the Health Care sector recorded a loss in December, the strength of the sector’s gains in October and November kept it in the pole position for Q4 returns. For the quarter (which was similar to the performance pattern in November) one stock, Eli Lilly, contributed some 42% of the sector’s return.
The Real Estate sector was the laggard for the quarter, with losses primarily from real estate investment trusts (REITs) and cellular tower providers. REITs that specialize in leasing properties to technology and biotechnology companies were particularly hard hit.
The Communication Services sector led all others on a year-to-date basis with two companies responsible for 91% of the sector’s overall return: Alphabet (parent company of Google, YouTube, Waymo, and Google Cloud) and Meta Platforms (Facebook, Instagram, WhatsApp).
The Information Technology sector, with an index weight totaling almost 33%, was the largest contributor to the S&P’s overall return for the year. There, three stocks—Nvidia (up 38.92%), Microsoft (up 15.59%), and Broadcom (up 50.65%)—were responsible for 67% of the sector’s overall return.
While all eleven sectors that comprise the S&P 500 finished the year in positive territory, Industrials was the only other sector (beyond the two aforementioned tech-heavy segments) that surpassed the return of the S&P 500 for the year with a gain of 19.27% versus the S&P’s 17.86% rise. The surge in capital expenditures for the AI data center build out was significant for many of the companies in the Industrials space.
As was the case in the fourth quarter, the Real Estate sector trailed all others over the full year.

In December, the rotation into value continued
During December, value outperformed growth for a second consecutive month by an average of 1.39% when measured across the three capitalization ranges of the major Russell benchmarks.
The Information Technology sector was once again responsible for the bulk of the large-cap value outperformance, gaining 3.26% in the value benchmark versus the 1.06% loss in the Russell 1000 Growth Index. In mid caps, it was much the same, with the Tech sector returning 3.85% for the month in the value index versus a loss of 3.32% for the sector in the Russell Midcap Growth Index. In small caps, the outperformance of the Russell 2000 Value Index was due to the Industrial sector, which returned 2.35% versus a loss of 3.06% for the sector in the Russell 2000 Growth Index.
Looking beyond the month, value also led growth during the fourth quarter by an average of 3.28% across the three market capitalization ranges; once again, gains in the Technology sector in both the Russell 1000 Value and Russell Mid-Cap Value benchmarks pushed those indexes higher, while losses in that sector for their growth counterparts weighed on returns. In the small-cap space, gains in Industrials and Financials in the Russell 2000 Value Index offset losses in those two sectors in the Russell 2000 Growth Index during the quarter.
For the year, growth led value among both large and small caps, but in the mid-cap space, the Russell Midcap Value Index outperformed the Russell Midcap Growth Index. The Communication Services and Financials sectors were the primary drivers of the mid-cap value outperformance for the year.
One note on stock concentration risk in the large-cap space: The top ten stocks in the Russell 1000 Growth Index represented 61.3% of the index and contributed to 74% of the index return for the year whereas the ten largest stocks in the Russell 1000 Value Index represented just 16.8% of the benchmark and 14% of its return for the year.
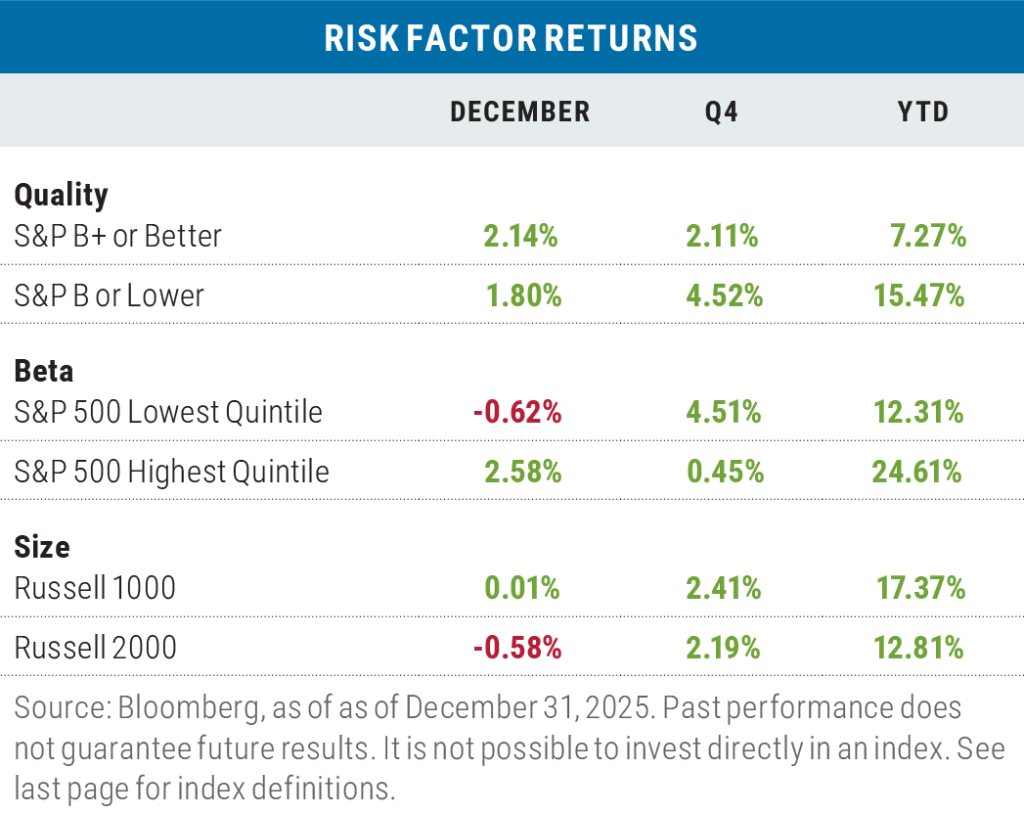

Risk factors were mixed throughout the year
In December, the risk-off characteristics of high quality and large size outperformed, whereas the risk-on characteristic of high beta beat low beta. For the quarter, the risk-off factors of low beta and large size were winners, but paradoxically, low quality also outperformed. (By way of background, low-quality stocks generally have high debt-to-equity ratios and low return-on-equity ratios.)
The risk-on trade dominated for the year, and although the usual risk-off (large) size factor outperformed, it was primarily due to the performance of mega-cap tech stocks: For the year, the Magnificent 7 stocks returned 24.90% versus a gain for the S&P 493 of 15.64%.
The rotation into international stocks continued in December
Both the EAFE Index of developed-market international stocks and the MSCI Emerging Market Index outperformed the S&P 500 over multiple time periods, including December, the fourth quarter, and the year on the whole, as investors increased flows to non-U.S. bourses throughout the year.
This was the first year the EAFE Index outperformed the S&P 500 since 2022 and the first time the MSCI Emerging Market Index did so since 2017. On a combined basis, 2025 was the best relative return for developed and emerging market stocks versus the S&P 500 since 2009.
For the U.S. dollar it was a different story, as the greenback’s year-to-date performance versus ten leading global currencies and twenty-four emerging market currencies was the worst since 2017. Global de-dollarization was a major theme in 2025 which was also reflected in the +67.4% return for gold during the year. Falling U.S. interest rates and rising twin deficits for the U.S. (both fiscal and current account) were the primary culprits behind the dollar’s decline, while global central banks desire to diversify their foreign currency reserve holdings served as an additional headwind.
Looking ahead
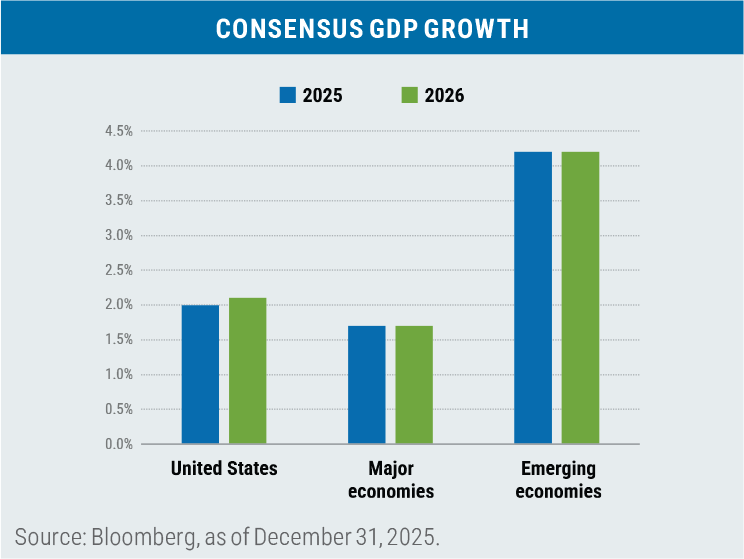
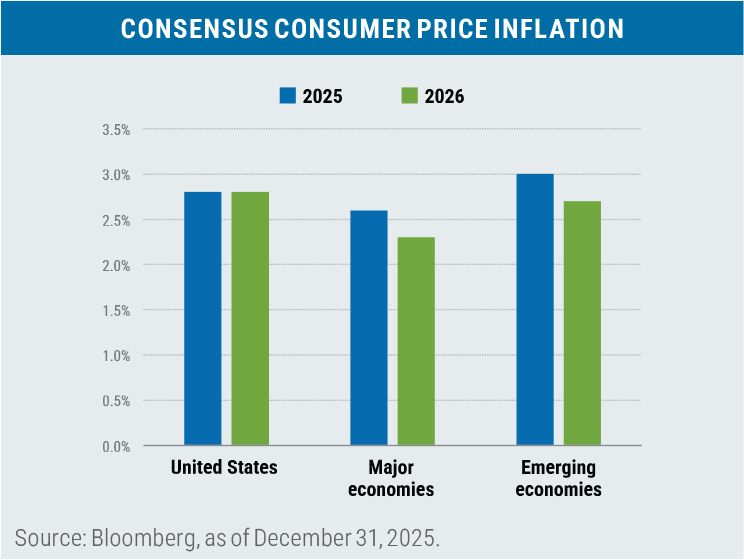
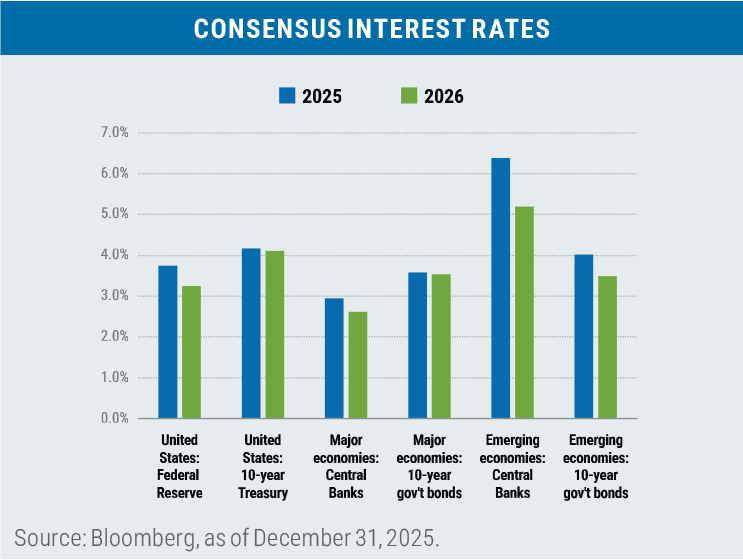
The primary factors that drove global returns in 2025 remain largely in place entering 2026: positive GDP and earnings growth paired with relatively low inflation and interest rates.
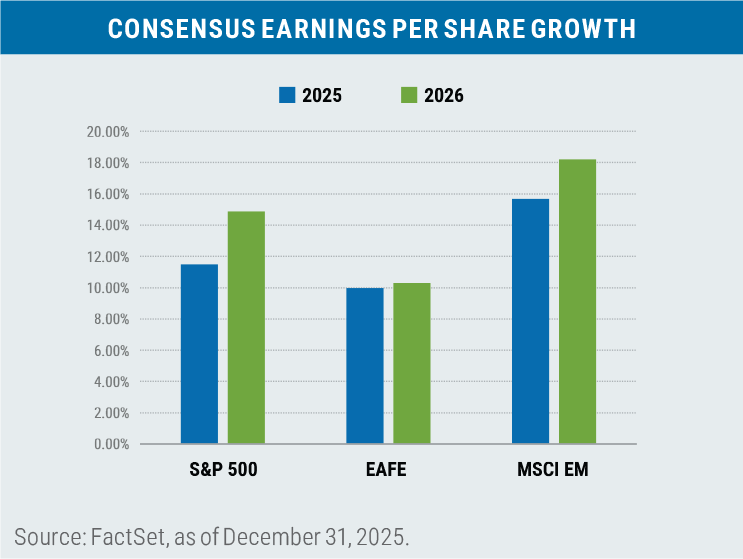
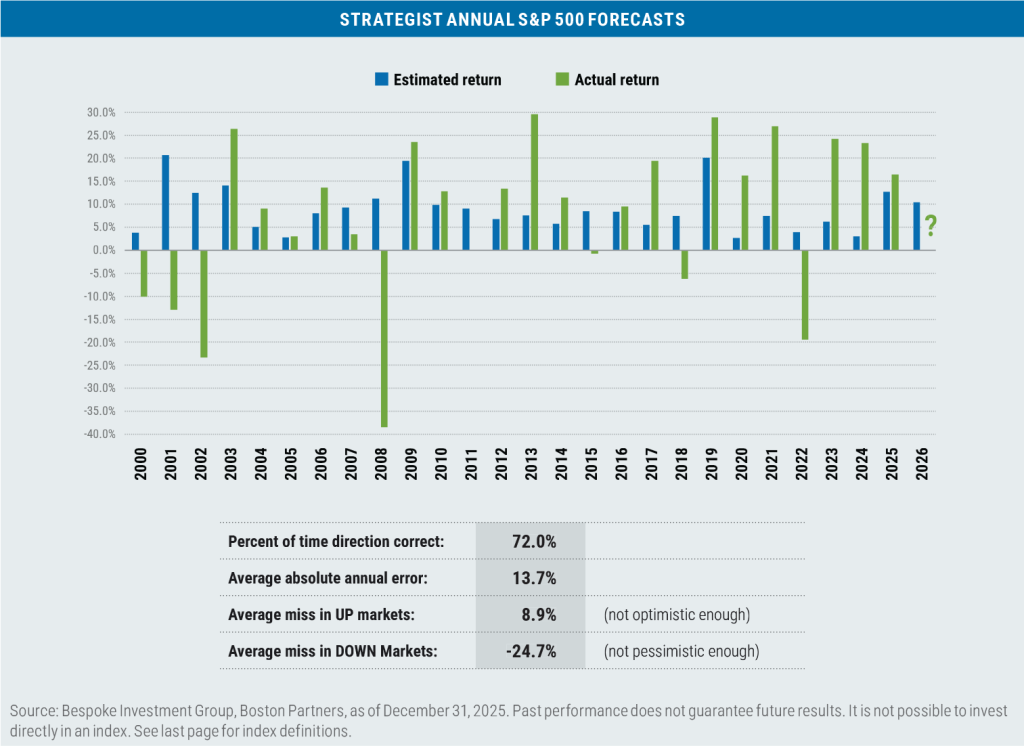
This positive macro backdrop is contributing to a relatively rosy set of strategist forecasts for major stock market returns in 2026.
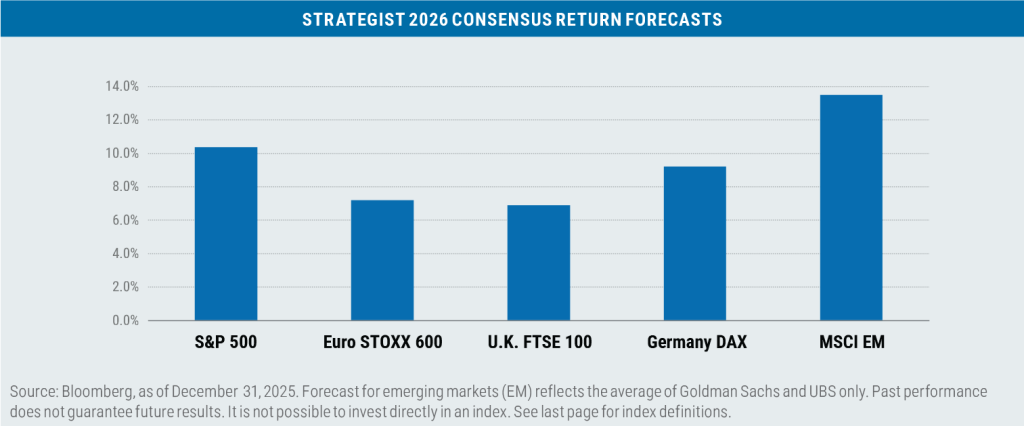
Perhaps these forecasts should be taken with a grain of salt, especially for the S&P 500: While the batting average of the strategists getting the direction of the return of the S&P 500 is respectable at 72% over the past quarter century, the magnitude of the forecasts’ misses leaves something to be desired.
Risks to the return picture
While the effects of tariffs have been less onerous than original estimates, that relief has largely been due to carve-outs that have reduced the overall tariff rate from the roughly 18% level of April to something closer to 11% today, though that rate remains a moving target. Also, most of the price increases have been absorbed by manufacturers and importers (representing margin hits) and by substitutions by consumers. How much longer that behavior prevails is a wild card. The decision on the legality of tariffs that were imposed under the International Emergency Economic Powers Act (IEEPA) is still pending in the U.S. Supreme Court.
While global AI capital expenditures are expected to increase from $423 billion in 2025 to $571 billion in 2026, how effectively those costs are monetized remains a concern for investors.
Meanwhile, President Trump’s “One Big Beautiful Bill” is expected to produce an incremental $158 billion in tax refunds for consumers in the first half of 2026, or approximately $1,000 per household. Whether that is spent, saved, or used to pay down debt could have a material effect on economic growth.
Geopolitical risk remains elevated, whether it be the war in Ukraine, China’s threats regarding Taiwan, ongoing unrest in the Middle East, or now the ultimate ramifications of the U.S. government’s Operation Absolute Resolve in Venezuela. On the domestic front, another U.S. federal government shutdown looms as do questions regarding the continuation of the Federal Reserve’s future independence under a new chair.
The S&P 500 has now clocked three consecutive years of returns exceeding 15%, something that has occurred only three other times since WWII. In two of those instances, markets experienced losses in the following year, with the S&P down 11.87% in 1946 and off by 19.44% in 2022. During the Dot-Com era, the rally proved unusually durable with gains for the S&P 500 for an additional two years—up 26.67% in 1998 and up 19.63% in 1999—but the downswing was equally severe, with three consecutive years of double-digit losses following that period.
Given the concentration risk in many capitalization-weighted stock indices and the length of the ongoing rally, particularly in the United States, efforts to diversify exposures both domestically and internationally remains a prudent choice.

Boston Partners Global Investors, Inc. (“Boston Partners”) is an investment adviser registered with the SEC under the Investment Advisers Act of 1940. The views expressed in this commentary reflect those of the author as of the date of this commentary. Any such views are subject to change at any time based on market and other conditions and Boston Partners disclaims any responsibility to update such views. Past performance is not an indication of future results.
Discussions of securities, market returns, and trends are not intended to be a forecast of future events or returns. You should not assume that investments in the securities identified and discussed were or will be profitable.
Important information
A basis point refers to a common unit of measure for interest rates and other percentages in finance. One basis point is equal to 1/100th of 1%, or 0.01%. Beta is a measure of a portfolio’s market risk relative to its benchmark. In general, a beta higher than 1.00 indicates a more volatile portfolio and beta lower than 1.00 indicates a less volatile portfolio in relation to its benchmark. The “greenback” is a colloquial term for the U.S. dollar. Comments from the Federal Reserve classified as either dovish or hawkish refers to the underlying stance on monetary policy: A dovish policy prefers lower interest rates to stimulate the economy, while a hawkish policy prefers higher rates to tamp down inflation and/or slow a potentially overheating economy. Gross domestic product (GDP) is the total market value of all the goods and services produced by a country and is a closely watched reflection of overall economic health. The International Emergency Economic Powers Act (IEEPA) is a United States federal law authorizing the president to regulate international commerce after declaring a national emergency in response to any unusual and extraordinary foreign threat to the United States. The One Big Beautiful Bill Act, signed into law in July 2025, represents a comprehensive tax and spending package combining major fiscal reforms, expanded social programs, and infrastructure investments. Operation Absolute Resolve was a U.S. military operation conducted on January 3, 2026, aimed at capturing Venezuelan President Nicolás Maduro and his wife, Cilia Flores. The two stand to face a variety of drug trafficking-related charges in federal court.
Index definitions
The Bloomberg U.S. Aggregate Bond Index tracks the performance of intermediate-term investment-grade bonds traded in the United States. The Bloomberg U.S. Dollar Index (DXY) is used to measure the value of the dollar against a basket of six foreign currencies. The value of the index is a fair indication of the dollar’s value in global markets. The DAX tracks the performance of the 40 largest companies trading on the Frankfurt Stock Exchange. The Euro STOXX 600 tracks the performance of 600 of the largest publicly traded companies across 17 European countries, representing a broad measure of the European equity market. The Financial Times Stock Exchange (FTSE) 100 tracks the performance of the 100 largest companies trading on the London Stock Exchange. The MSCI Emerging Markets (EM) Currency Index tracks the performance of emerging market currencies relative to the U.S. dollar where the weight of eachcurrency is equal to its country weight in the MSCI Emerging Markets Index. The MSCI EAFE Index tracks the performance of large- and mid-cap equities traded across global developed markets, excluding the United States and Canada. The MSCI Emerging Markets Index tracks the performance of large- and mid-cap equities traded in global emerging markets. The Russell 1000 Index tracks the performance of the 1,000 largest companies traded in the United States. The Russell 2000 Index tracks the performance of the 2,000 smallest companies traded in the United States. The Russell 1000 Growth and Value Indexes track the performance of those large-cap U.S. equities in the Russell 1000 Index with growth and value style characteristics, respectively. The Russell 2000 Growth and Value Indexes track the performance of those small-cap U.S. equities in the Russell 2000 Index with growth and value style characteristics, respectively. The Russell Midcap Growth and Value Indexes track the performance of those mid-cap U.S. companies in the Russell 1000 Index with growth and value style characteristics, respectively. The S&P 500 Index tracks the performance of the 500 largest companies traded in the United States. The S&P 500 Equal Weight Index also tracks the performance of the 500 largest companies traded in the United States, but weights each company equally, rather than proportionally according to market cap. S&P credit ratings, which range from AAA (highest) to D (default), are assigned by S&P Global to individual companies to indicate their relative creditworthiness. It is not possible to invest directly in an index.
Market capitalization breakpoints
The breakpoints for capitalization ranges should be viewed only as guideposts and will change over time. In general, FTSE Russell (which maintains a number of stock-market indexes based on company size) considers small-cap stocks to have market caps of between $150 million and $7 billion, mid caps to have market caps between $7 billion and $150 billion, and large caps to be those companies with market caps above $150 billion.
Boston Partners Global Investors, Inc. (Boston Partners) is composed of three divisions, Boston Partners, Boston Partners Private Wealth, and Weiss, Peck & Greer (WPG) Partners, and is an indirect, wholly owned subsidiary of ORIX Corporation of Japan (ORIX).
8701402.1