Mullaney on the Markets
I’ll take my “marketini” rotated, not shaken
By Michael Mullaney | Director of Global Markets Research
Published August 2026
Please excuse the play on the famous line delivered by James Bond in many of the movie franchise releases. The point is that while the headline returns of several major equity benchmarks were negative in July, beneath the surface there were numerous pockets of strength worth scrutinizing.
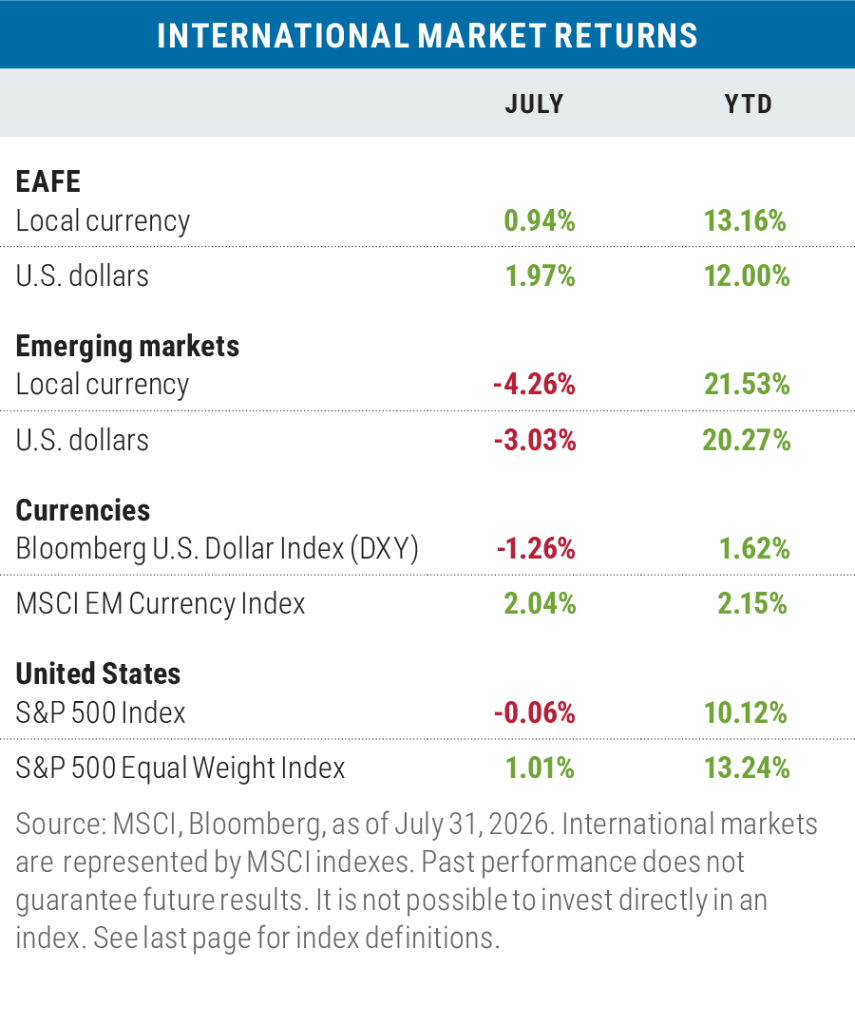
For example, while the S&P 500 fell by 0.06% in July, the S&P 500 Equal Weight Index gained 1.01% as investors continued to rotate out of stocks that had led earlier in the year and into those that had lagged. Other examples include the Philadelphia Stock Exchange Semiconductor Index (SOX), which through June had returned 101.73%, but fell by 20.58% in July; meanwhile, the S&P 500 Software Industry Index, which had dropped by 20.61% through June, gained 14.71% in July. Likewise, the 3.31% drop posted by the tech-heavy Nasdaq Composite Index contrasted with the 0.32% gain of the Dow Jones Industrials Average during the month. Developed market international stocks also continued to perform well, with the MSCI EAFE Index gaining 1.97% in July, outpacing the S&P 500.
More telling of the underlying strength and breadth of the market is the percentage of stocks in the S&P 500 that are trading above their 200-day moving average, currently 69% versus a low of 42% in March and a 62% reading on July 1.
Bonds, for their part, failed to gain footing in July; while the Federal Open Market Committee of the Federal Reserve held rates steady at its meeting, there were three regional bank dissenters (the most since 2016) that voted to increase rates, which in turn increased the odds of a Fed rate hike in September. For the month, the Bloomberg U.S. Aggregate Bond Index (the Agg) dropped by 1.30%.
Year to date, the S&P 500 has returned 10.12%, the MSCI EAFE is up +12.00%, and the Bloomberg Agg is down 0.69%.
Sector returns in July
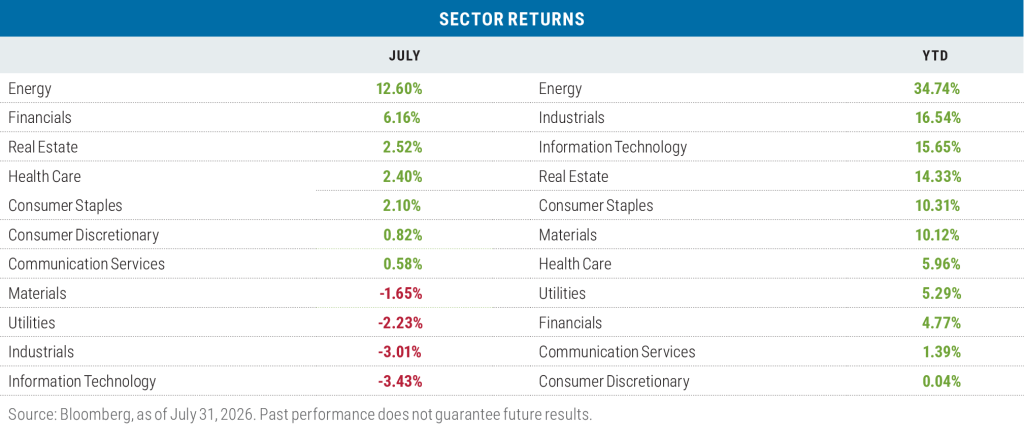
Energy led all sectors of the S&P 500 in July after the price of both West Texas Intermediate (WTI) and Brent Crude oil rebounded more than 15% from July 8—when President Trump declared that the Islamabad Memorandum of Understanding (MOU) between the United States of America and the Islamic Republic of Iran—was “over,” triggering another round of military strikes and subsequent retaliation throughout the Middle East.
Pulling up the rear for the month was the Information Technology sector, which was not surprising given the weakness in semiconductor stocks. While memory chip maker SanDisk had the greatest loss in the sector (down 46.57%), it was Micron Technology falling by 28.69% that accounted for 44% of the sector’s loss during July given its weight within the index. (Prior to the July reversal, the stock had tripled in price this year through June.)
With the strong return generated in July, Energy regained the lead on a year-to-date basis for all S&P 500 sectors, while the Consumer Discretionary sector fell into last place with a scant return of just 0.04%. The 30.80% loss for Tesla withinthat sector was an almost equal offset to the 17.66% gain posted by Amazon, given the stocks’ respective weights within the index (1.86% versus 3.79%).
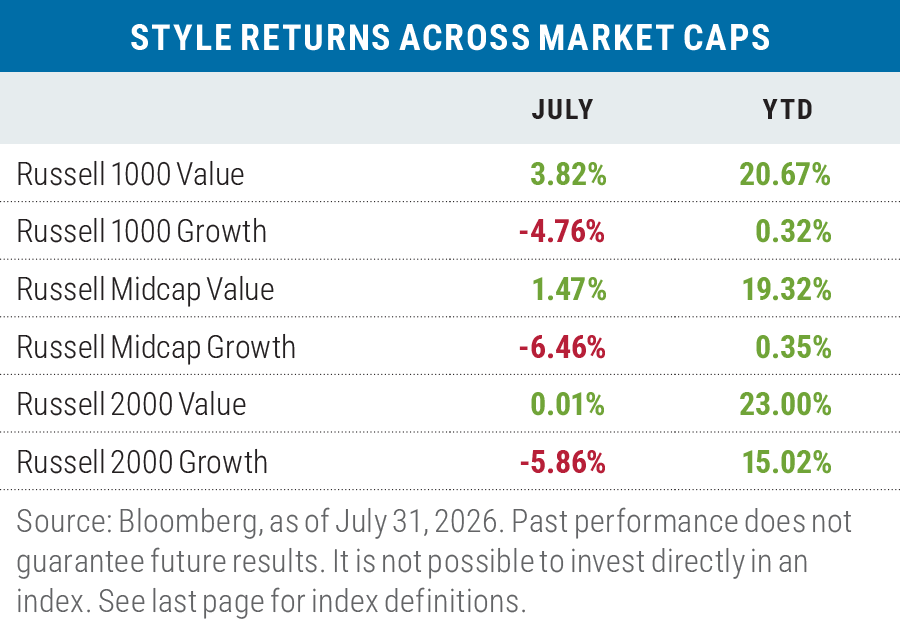
Value led growth by 7.46% in July when averaged across the three Russell market capitalization ranges, the largest monthly style return differential since January 2022. For the large-cap space, it was the Information Technology sector that was the primary driver of the return differential, where the Russell 1000 Value Index posted a return of 2.27% for the sector versus a loss of 5.56% in the Russell 1000 Growth Index. For mid caps, it was the Industrials sector (2.68% for value, down 13.05% for growth), while in small caps, it was Financials, which finished up 2.28% for the Russell 2000 Value Index versus up 1.93% for the Russell 2000 Growth Index; Financials in the value index represent 28.93% of the benchmark versus just 9.94% of the growth index.
Year to date, value is leading growth by an average of 15.76% across the three capitalizations, once again the largest differential since 2002, with the Technology sector responsible for 48.9% of the Russell 1000 differential, 36.4% of the Russell Mid Cap differential, and 56.9% of the return differential between the Russell 2000 Value Index and theRussell 2000 Growth Index.
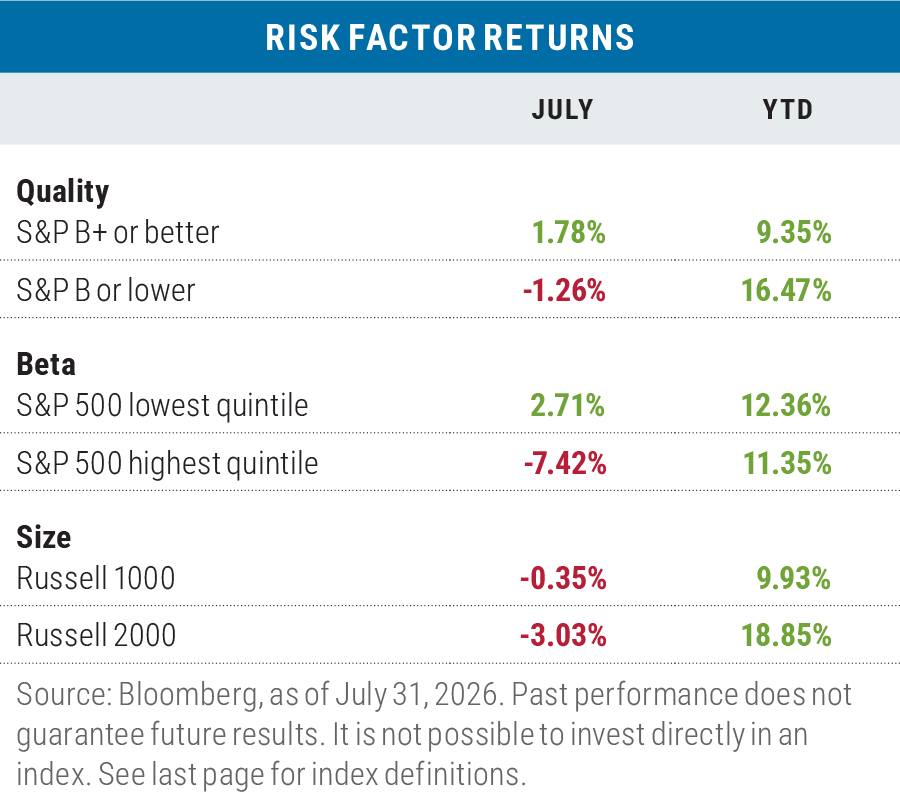
July: a risk-off factor monthJuly saw a high-quality, low-beta, and large-size factor sweep as investors retrenched from previous high-momentum names. On a year-to-date basis, the earlier strength shown by the “risk on” factors of low-quality and small-size stocks have prevailed, though low-beta continues to lead high-beta.
Mixed results for non-U.S. stocks in JulyDeveloped market international stocks (as measured by the MSCI EAFE) beat the S&P 500 in July in both local currency and U.S. dollar (USD) terms, though returns in USD were higher given the weakness of the dollar, as reflected by the DXY Index’s decline versus a basket of six foreign currencies. In a reversal of fortune, emerging market stocks fell sharply in both local currency and U.S. dollar terms during the month, stung by a 17.11% loss (in USD) and 23.73% loss (local) by South Korea. There, two chip stocks contributed to a large portion of the damage: SK Hynix (down 29.55%) and Samsung Electronics (down 14.59). Together these two stocks account for 13.15% of the total index.
Year to date, emerging market stocks continue their lead over the S&P 500 in local currency and dollar terms, with South Korea (up 80.30%; 78.44% local) and Taiwan (up 52.29%; 56.65% local) maintaining their dominance in the performance of the overall EM Index.
Looking ahead
Historically there have been two primary drivers of stock prices, earnings and interest rates. Earnings drive a stock’s fundamental value by highlighting a company’s profitability, while interest rates dictate the cost of money and influence how much investors are willing to pay for those future profits.
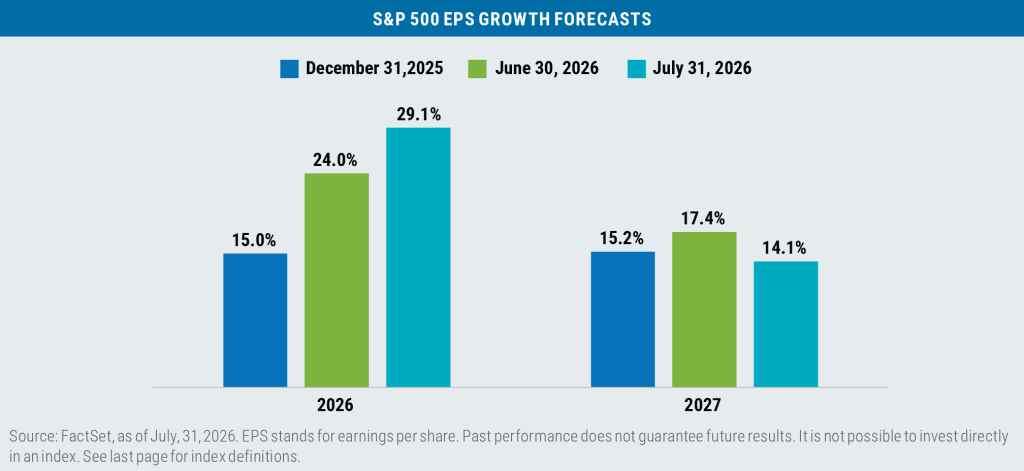
Currently, the earnings side of the equation has strengthened, with projected earnings growth for the S&P 500 in 2026 continues to be revised upward, putting it on its fastest pace since the post-COVID bounce in 2021, with projections for 2027 also remaining at an above average level.
The other side of the equation, interest rates, is less bullish as stubborn levels of inflation and mounting debt levels continue to pressure the bond market.
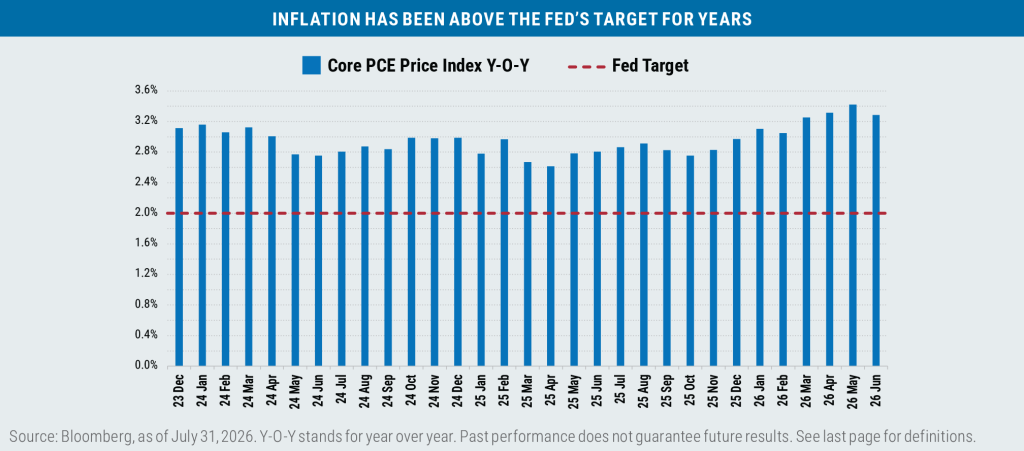
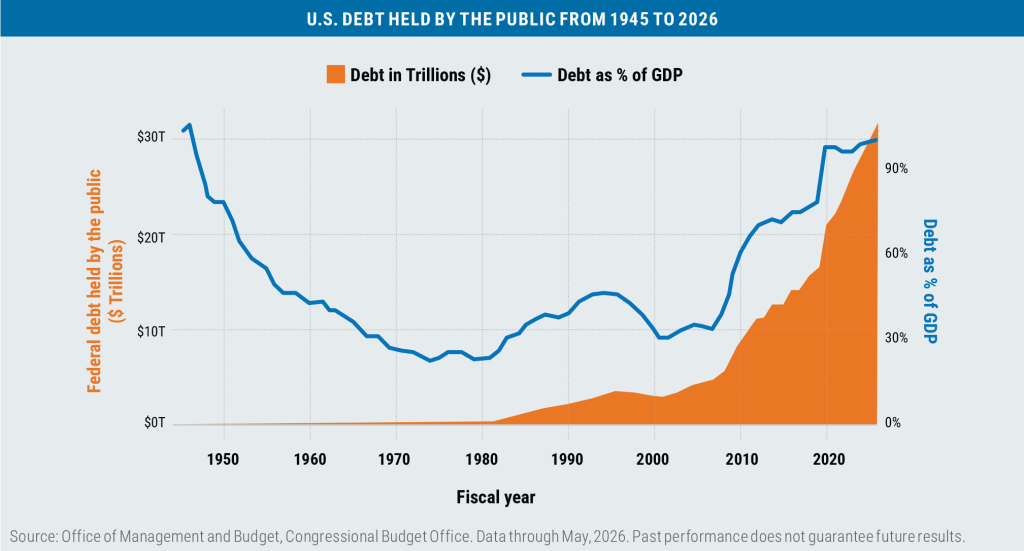
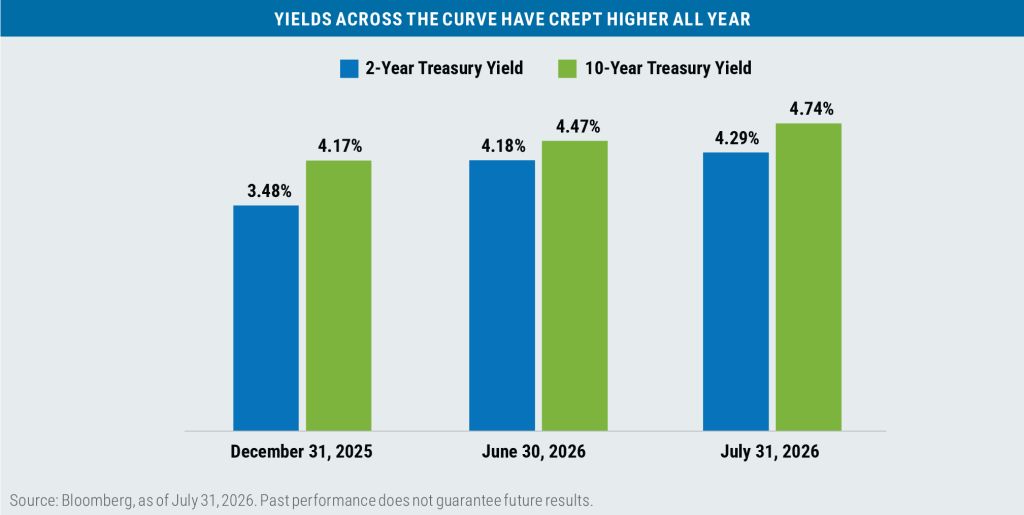
This has led to the futures market to anticipate higher policy rates sooner, moving from pricing in a 25 basis point rate cut by the Federal Reserve this fall to now a 72% chance of a 25 basis point rate hike at the FOMC meeting in September.
Meanwhile, how investors react to little (or no) forward guidance from the Federal Reserve under Kevin Warsh remains an open question, but the first FOMC post-meeting statement under his stewardship on June 17 contained just 162 words, the fewest since 2007 and well below former chair Jerome Powell’s 397-word average.
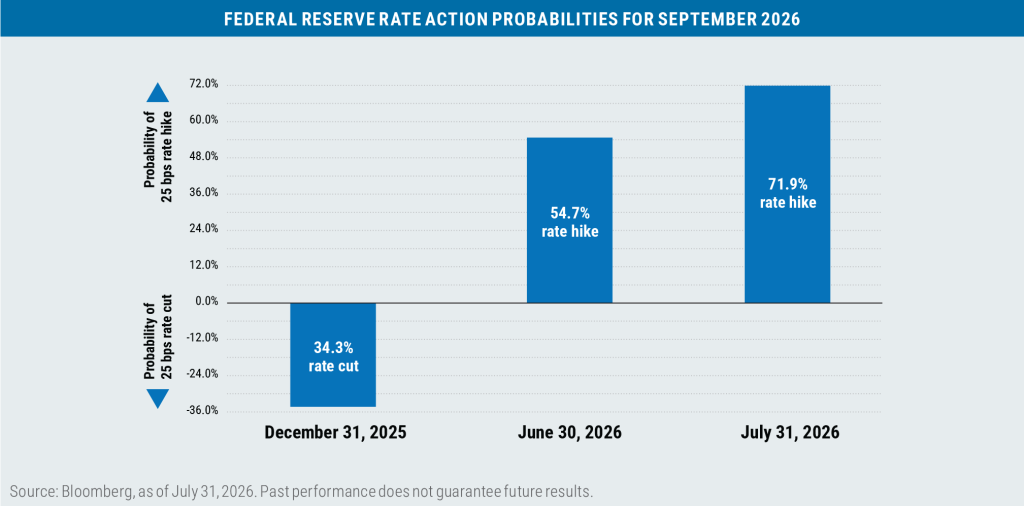
The takeaway: Stubborn inflation and debt levels may translate into lower price/earnings multiples, which may or may not be offset by rising earnings. At what level higher interest rates (and how fast rates get to that level) start to cause problems for the equity market remains the $64,000 question for investors.
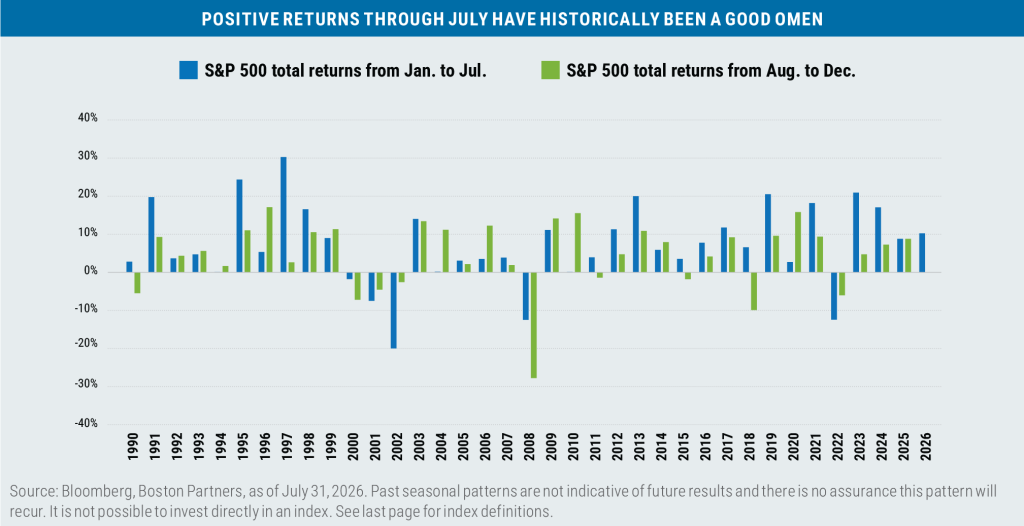
From a technical standpoint the stock market remains in good shape, though: Since 1990, when the total return of the S&P 500 has been positive through July, the index has gone on to higher returns for the last five months of the year 75% of the time, with an average return over that period of 8.56%… or as Adam Sandler would say, “Not too shabby.”
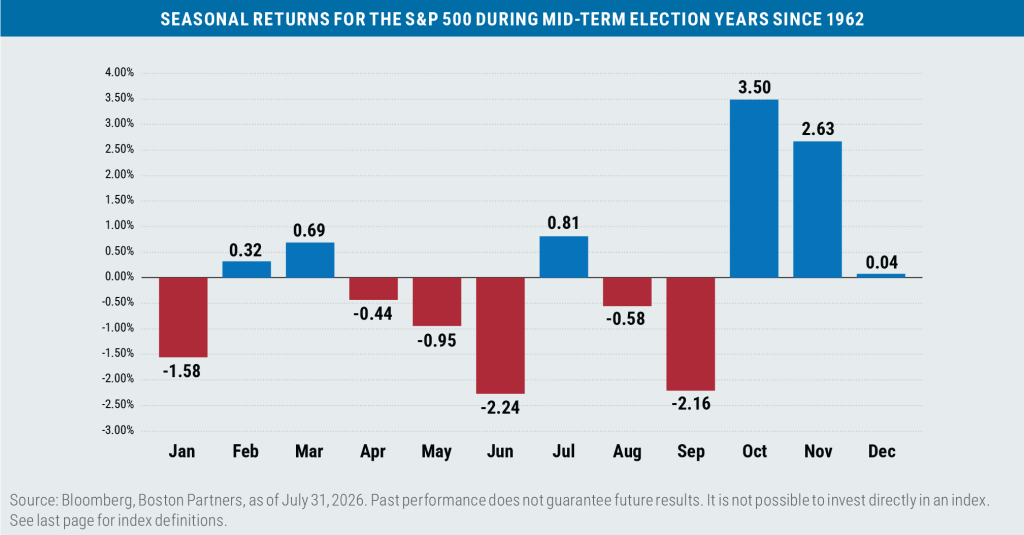
In the near term, some consolidation of returns would not be unprecedented from a seasonality standpoint, as during mid-term election years the investors struggle to come to grips with who the candidates are before the elections, what their policy positions are, and the likelihood of them being elected. After those issues have been resolved, the market has historically regained its footing heading into year end.

Boston Partners Global Investors, Inc. (“Boston Partners”) is an investment adviser registered with the SEC under the Investment Advisers Act of 1940. The views expressed in this commentary reflect those of the author as of the date of this commentary. Any such views are subject to change at any time based on market and other conditions and Boston Partners disclaims any responsibility to update such views. Past performance is not an indication of future results.
Discussions of securities, market returns, and trends are not intended to be a forecast of future events or returns. You should not assume that investments in the securities identified and discussed were or will be profitable.
Important information
Beta is a measure of a portfolio’s market risk relative to its benchmark. In general, a beta higher than 1.00 indicates a more volatile portfolio and beta lower than 1.00 indicates a less volatile portfolio in relation to its benchmark. Core PCE (Personal Consumption Expenditures) is a measure of inflation that excludes the prices of food and energy, which tend to be more volatile. The Federal Open Market Committee (FOMC) is a rotating group of 12 members of the Federal Reserve system tasked with setting and implementing monetary policy. West Texas Intermediate (WTI) and Brent crude are two of the more easily refined types of oil and serve as key benchmarks for oil prices.
Index definitions
The Bloomberg U.S. Aggregate Bond Index (Agg) tracks the performance of intermediate-term investment-grade bonds traded in the United States. The Bloomberg U.S. Dollar Index (DXY) is used to measure the value of the dollar against a basket of six foreign currencies. The value of the index is a fair indication of the dollar’s value in global markets. The Dow Jones Industrial Average (DJIA) is a stock market index that tracks the performance of 30 large, publicly traded companies in the United States. The MSCI Emerging Markets (EM) Currency Index tracks the performance of emerging market currencies relative to the U.S. dollar where the weight of each currency is equal to its country weight in the MSCI Emerging Markets Index. The MSCI EAFE Index tracks the performance of large- and mid-cap equities traded across global developed markets, excluding the United States and Canada. The MSCI Emerging Markets Index tracks the performance of large- and mid-cap equities traded in global emerging markets. The MSCI World ex U.S. Index tracks the performance of large- and mid-cap equities traded across global developed markets, excluding the United States. The Nasdaq Composite Index is a capitalization-weighted index that tracks nearly all stocks listed on the Nasdaq stock exchange, which itself generally tilts toward technology companies. The Philadelphia Stock Exchange Semiconductor Index (SOX) tracks the capitalization-weighted performance of the 30 largest U.S.-traded companies involved in the design, manufacture, and sale of semiconductors. The Russell 1000 Index tracks the performance of the 1,000 largest companies traded in the United States. The Russell 2000 Index tracks the performance of the 2,000 smallest companies traded in the United States. The Russell 1000 Growth and Value Indexes track the performance of those large-cap U.S. equities in the Russell 1000 Index with growth and value style characteristics, respectively. The Russell 2000 Growth and Value Indexes track the performance of those small-cap U.S. equities in the Russell 2000 Index with growth and value style characteristics, respectively. The Russell Midcap Growth and Value Indexes track the performance of those mid-cap U.S. companies in the Russell 1000 Index with growth and value style characteristics, respectively. The S&P 500 Index tracks the performance of the 500 largest companies traded in the United States. The S&P 500 Equal Weight Index also tracks the performance of the 500 largest companies traded in the United States, but weights each company equally, rather than proportionally according to market cap. S&P credit ratings, which range from AAA (highest) to D (default), are assigned by S&P Global to individual companies to indicate their relative creditworthiness. It is not possible to invest directly in an index.
Market capitalization breakpoints
The breakpoints for capitalization ranges should be viewed only as guideposts and will change over time. In general, FTSE Russell (which maintains a number of stock-market indexes based on company size) considers small-cap stocks to have market caps of between $150 million and $7 billion, mid caps to have market caps between $7 billion and $150 billion, and large caps to be those companies with market caps above $150 billion.
Boston Partners Global Investors, Inc. (Boston Partners) is composed of three divisions, Boston Partners, Boston Partners Private Wealth, and Weiss, Peck & Greer (WPG) Partners, and is an indirect, wholly owned subsidiary of ORIX Corporation of Japan (ORIX).
9019993.2