Mullaney on the Markets
Like a good neighbor, Jay Powell is there
By Michael Mullaney | Director of Global Markets Research
Published October 2025
U.S. Federal Reserve Chair Jerome (“Jay”) Powell took out an insurance policy against softening job growth on September 17 when the Federal Open Markets Committee (FOMC) cut the fed funds rate by 25 basis points to a new band of 4.00% to 4.25%. The committee cited labor market strength (or lack thereof) had taken precedence over fighting inflation in their dual mandate to promote maximum employment and price stability… at least for the moment. The rate cut helped the S&P 500 Index dodge what has historically been the cruelest month of the year for the stock market, as the S&P gained 3.65%, its best return for September since 2010.
The Fed move also helped lift bond returns: The Bloomberg U.S. Aggregate Bond Index advanced by 1.09% as yields for Treasury securities with maturities from three months to 30 years fell by an average of 9 basis points for the month, led by 1-year Treasury bills that wound up 22 basis points lower, closely mirroring the Fed’s move. The yield movements along the rest of the yield curve were somewhat muted as the rate cut was highly anticipated throughout the entire month.
For the quarter, the S&P 500 advanced by 8.11%, its best return for the third quarter since 2020, while year to date the index gained 14.81%.
On the bond side, the Bloomberg U.S. Aggregate Bond Index returned 2.03% for the quarter and 6.13% year to date and is headed towards its best year since 2020.
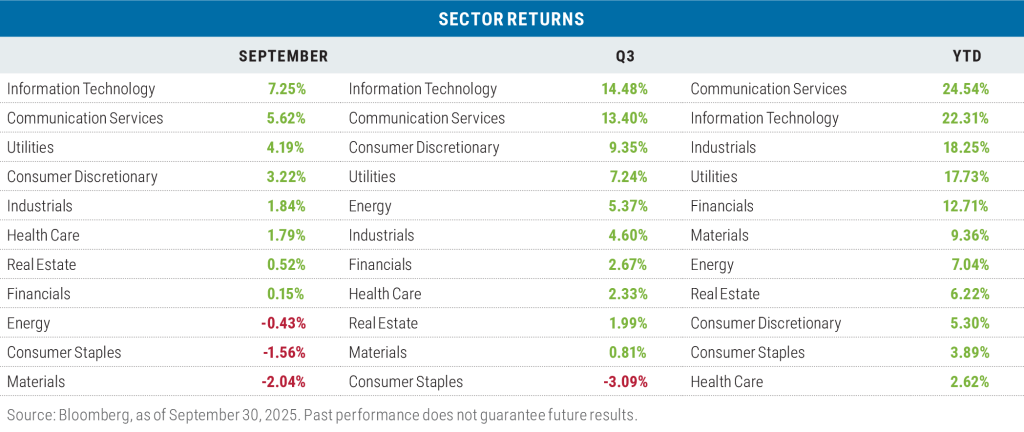
Sector leaders in September: the usual suspects
A series of outlandish capital expenditure announcements by artificial intelligence hyperscalers (Alphabet, Amazon, Meta Platforms, Microsoft, Oracle) and their suppliers (Nvidia, Palantir Technologies, Intel, etc.) lifted both the Information Technology and the Communication Services sectors to the pole positions for returns on a monthly, quarterly, and year-to-date basis.
Hyperscalers are now responsible for approximately 30% of the total capital expenditures of the companies in the S&P 500 and have accounted for upwards of 90% of the benchmark companies’ cap-ex spending growth over the past three years.
The three sectors posting losses for September are among those with the greatest exposure to increased tariff costs, which also dragged the Consumer Staples sector into the red for the quarter. Year to date, Health Care continued to suffer from tariff exposure and the federal government’s push to lower health care costs, particularly drug prices.
Style returns were mixed in September and for the quarter, while growth led YTD
In September, the biggest discrepancy in performance was between the Russell 1000 Growth and Value Indexes, with growth outperforming by 3.82%. This is not surprising given that the Magnificent 7 stocks returned 9.01% for the month versus 2.24% for the “S&P 493” and wound up contributing 70% of the performance gap between the Russell 1000 Growth and Value Indexes. Those seven stocks represent over 53% of the Russell 1000 Growth Index.
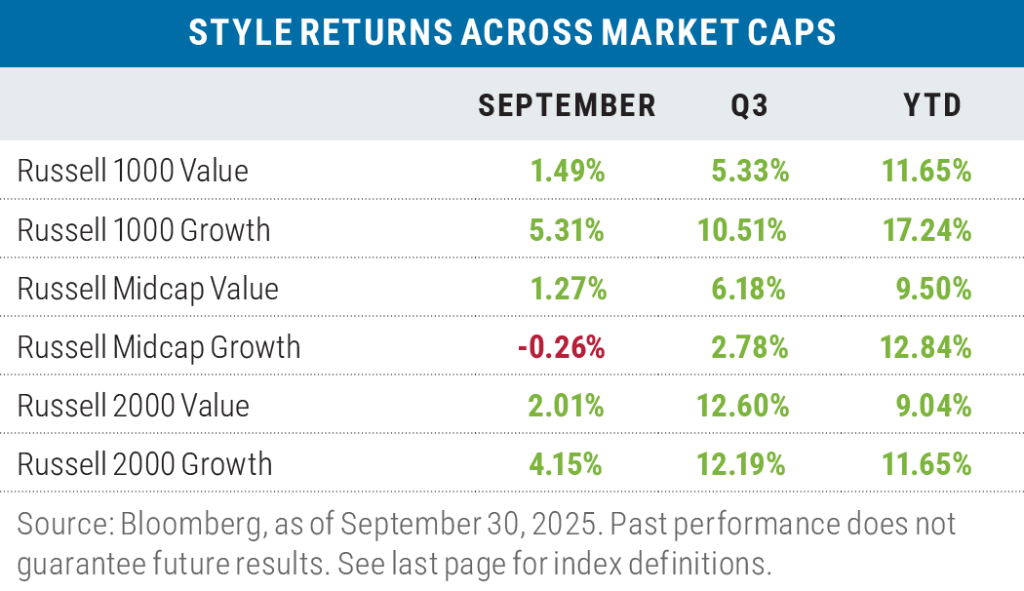
Likewise for the quarter and the year-to-date period, the Magnificent 7 were responsible for 77% and 54% of the return differential between the Russell 1000 Growth Index and the Russell 1000 Value Index, respectively.
Value held up better in the mid-cap space, outperforming growth in September and for the quarter, with the Consumer Discretionary sector driving 75% of the Russell Midcap Value Index’s outperformance in September, and Financials accounting for 33% of value’s outperformance during the quarter.
In small caps, value was only able to beat growth during the third quarter, aided by the 8.47% gain of the Health Care sector in the Russell 2000 Value Index versus a -9.80% loss for that sector in the Russell 2000 Growth Index.
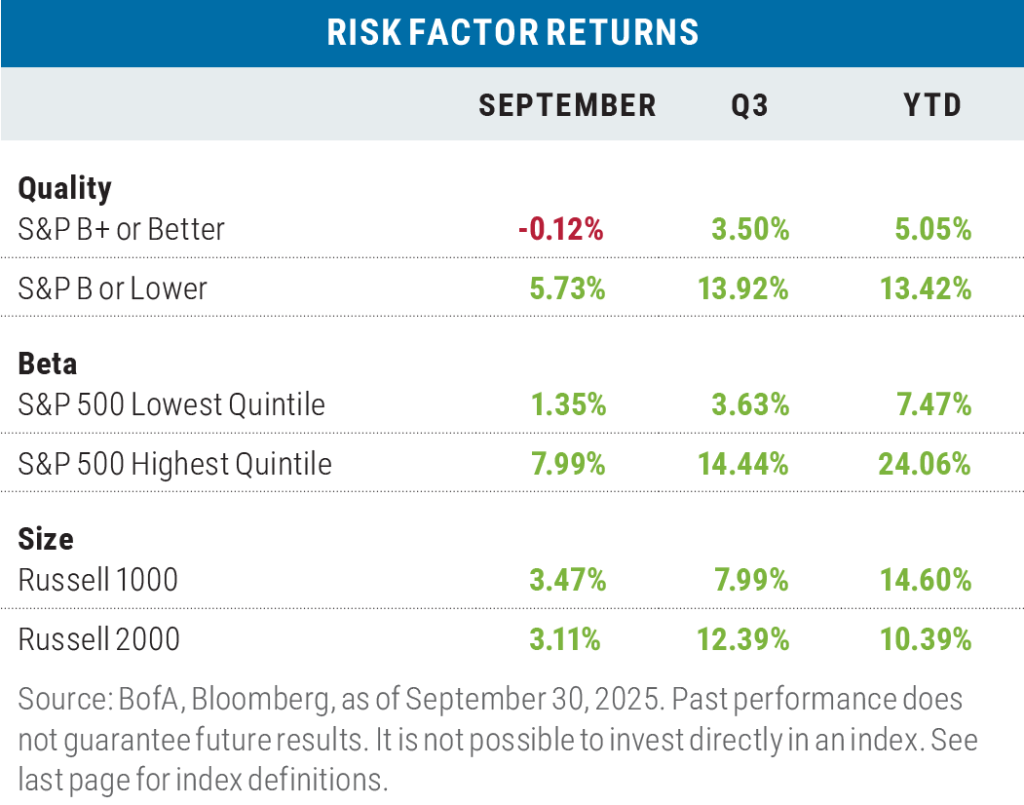
More “risk on” than not in September; for Q3, “risk on” goes turbo
Low-quality and high-beta factors significantly outperformed their counterparts during the month, while small sized companies basically held their own versus large. For the quarter, risk-on was dominant given greater tariff certainty, higher-than-consensus earnings results, and the first of several expected Fed rate cuts, all of which helped to lift investors’ spirits. Year to date, only the small size factor has missed out on the risk-on theme that’s prevailed, though in Q3 the small stock factor made up significant ground, turning in the best quarter for small-caps versus large-caps since Q3 2021.
Mixed results for non-U.S. stocks again in September
While developed market stocks failed to keep pace with the cap-weighted S&P 500 for September and the quarter, they were able to match or beat the equal-weighted S&P 500 over those periods in both local currency and U.S. dollar terms, in part due to equity inflows finding their way into markets outside of the United States. While slightly lagging the cap-weighted S&P 500 on a year-to date basis in local currency terms, the EAFE Index significantly outperformed the S&P when measured in $USD terms given the strength of the underlying currencies versus the dollar.
Emerging-market stocks fared even better, handily beating the S&P 500 in all periods whether measured in local currencies or dollar terms. The emerging markets have been buoyed by a series of global central bank rate cuts that investors hope will produce a cyclical/global economic recovery.
Looking ahead
From 1981 forward, rate cut cycles by the Federal Reserve have traditionally been good for stock returns, provided that a recession wasn’t immediately on the horizon, particularly over the next 12 months.
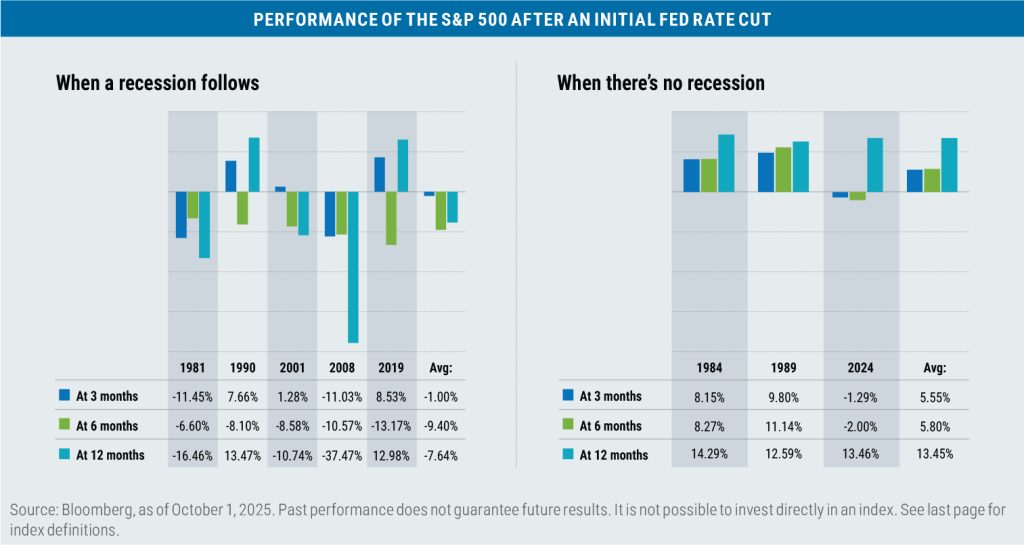
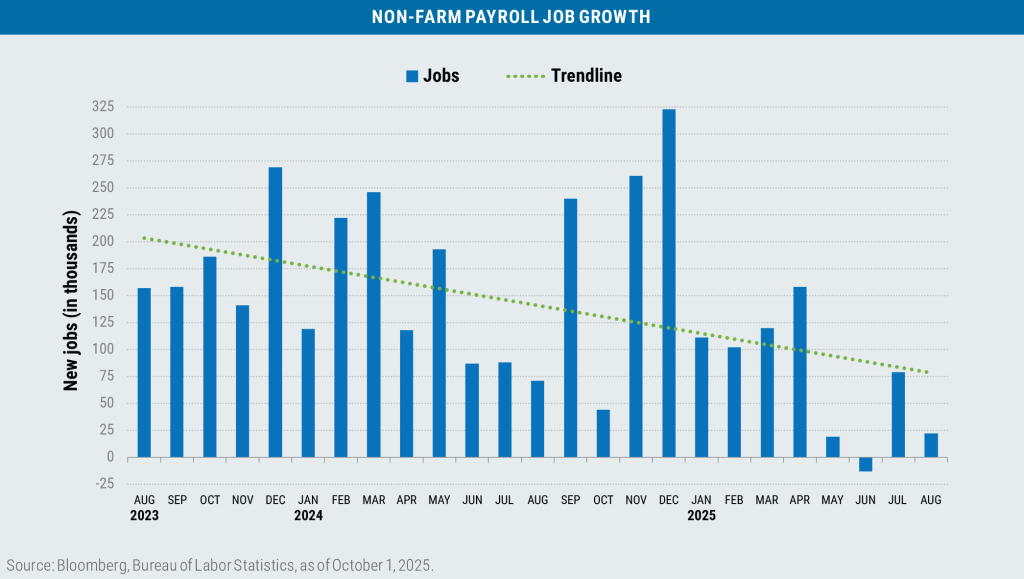
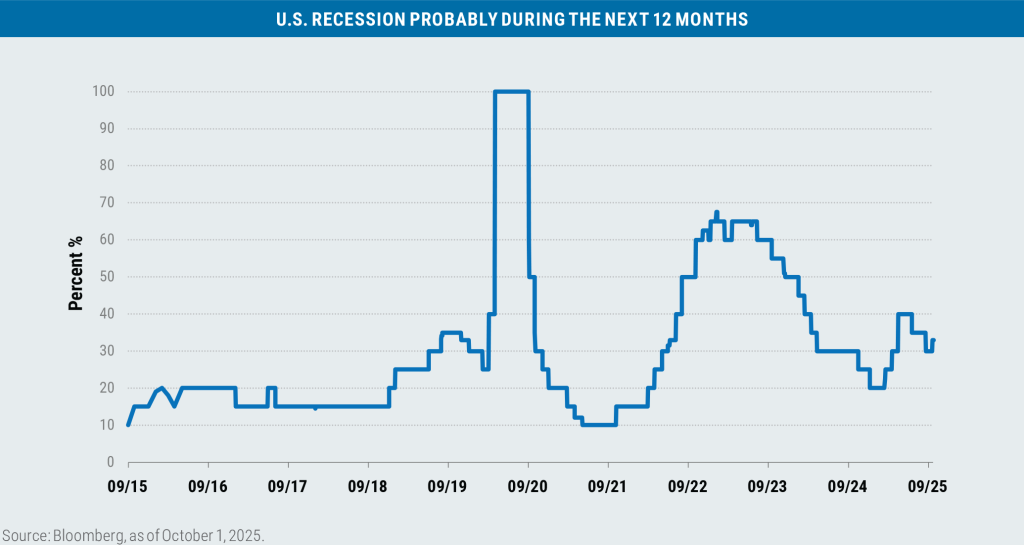
While weakness in job growth has been broadly noted of late, the recession risk over the next 12 months remains low
according to a survey of 47 economists surveyed by Bloomberg Economics.
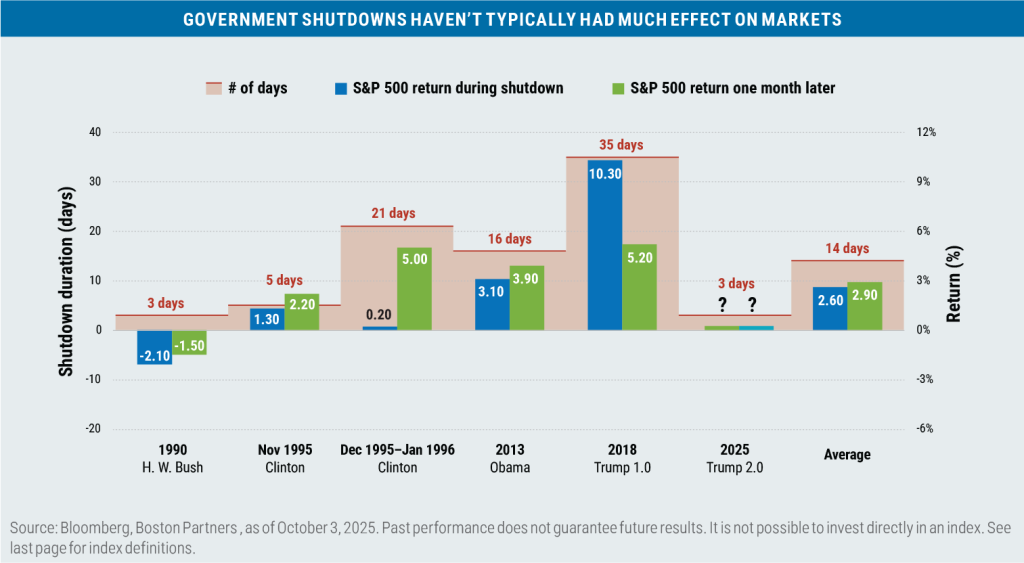
Speaking of work, as of this writing, the United States is in the third day of a government shutdown. Since 1990 there have been six occasions that the government has shut down for three days or longer, including the current one. Only one shutdown (1990) resulted in a loss for the S&P 500 during the shutdown period (–2.1%) while the average gain over the prior five periods was 2.6%. The average gain for the one-month period following the reopening of the government was 2.9%.
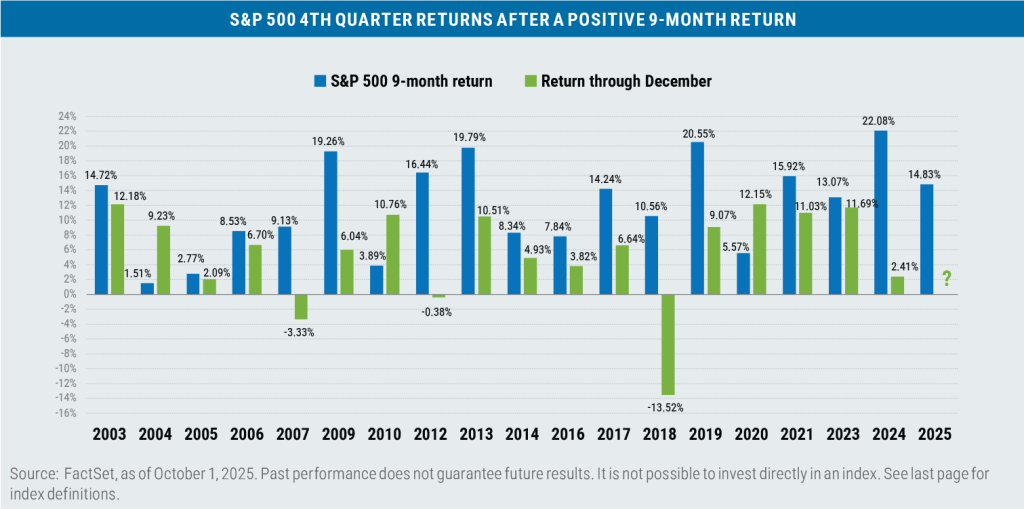
Seasonal momentum also favors a continuation of the recent positive returns for the S&P 500: Since 2002, there have been 18 years when the S&P 500 has produced a gain through the first nine months of the year, and in 15 of those occurrences (83%) the S&P has gone on to also post a gain for the final three months of the year.
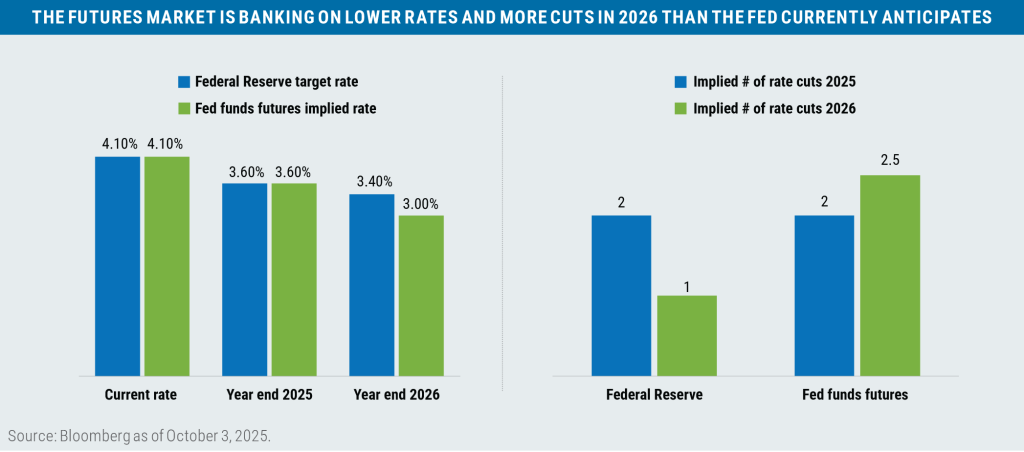
One potential fly in the ointment for both bonds and stocks is that the fed funds futures market is pricing in a more dovish/friendly Federal Reserve in 2026 than the current Summary of Economic Projections by the Fed would indicate, meaning for the Fed to meet the current expectations of market participants (by cutting rates well into next year), then the job market would need to soften further and inflation would need to stay near its current levels—or, even better, continue to moderate. With the full effects of the tariffs not expected to hit the economy/inflation until mid 2026, accommodating that futures market projection may prove to be a tall order for the neighborly Mr. Powell.

Important disclosures
Boston Partners Global Investors, Inc. (“Boston Partners”) is an investment adviser registered with the SEC under the Investment Advisers Act of 1940. The views expressed in this commentary reflect those of the author as of the date of this commentary. Any such views are subject to change at any time based on market and other conditions and Boston Partners disclaims any responsibility to update such views. Past performance is not an indication of future results.
Discussions of securities, market returns, and trends are not intended to be a forecast of future events or returns. You should not assume that investments in the securities identified and discussed were or will be profitable.
Terms and definitions
Beta is a measure of a portfolio’s market risk relative to its benchmark. In general, a beta higher than 1.00 indicates a more volatile portfolio and beta lower than 1.00 indicates a less volatile portfolio in relation to its benchmark. The Bloomberg U.S. Aggregate Bond Index tracks the performance of intermediate-term investment-grade bonds traded in the United States. The Bloomberg U.S. Dollar Index (DXY) is used to measure the value of the dollar against a basket of six foreign currencies. The value of the index is a fair indication of the dollar’s value in global markets. The Federal Open Market Committee (FOMC) is a rotating group of 12 members of the Federal Reserve system tasked with setting and implementing monetary policy. Hyperscalers are large-scale data centers used for cloud computing and data management, and can refer to the companies that provide such services. The Magnificent Seven stocks are a group of high-performing and influential companies in the U.S. stock market: Alphabet, Amazon, Apple, Meta Platforms, Microsoft, NVIDIA, and Tesla. The MSCI Emerging Markets (EM) Currency Index tracks the performance of emerging market currencies relative to the U.S. dollar where the weight of each currency is equal to its country weight in the MSCI Emerging Markets Index. The MSCI EAFE Index tracks the performance of large- and mid-cap equities traded across global developed markets, excluding the United States and Canada. The MSCI Emerging Markets Index tracks the performance of large- and mid-cap equities traded in global emerging markets. The Russell 1000 Index tracks the performance of the 1,000 largest companies traded in the United States. The Russell 2000 Index tracks the performance of the 2,000 smallest companies traded in the United States. The Russell 1000 Growth and Value Indexes track the performance of those large-cap U.S. equities in the Russell 1000 Index with growth and value style characteristics, respectively. The Russell 2000 Growth and Value Indexes track the performance of those small-cap U.S. equities in the Russell 2000 Index with growth and value style characteristics, respectively. The Russell Midcap Growth and Value Indexes track the performance of those mid-cap U.S. companies in the Russell 1000 Index with growth and value style characteristics, respectively. The S&P 500 Index tracks the performance of the 500 largest companies traded in the United States. The S&P 500 Equal Weight Index also tracks the performance of the 500 largest companies traded in the United States, but weights each company equally, rather than proportionally according to market cap. S&P credit ratings, which range from AAA (highest) to D (default), are assigned by S&P Global to individual companies to indicate their relative creditworthiness. It is not possible to invest directly in an index.
Market capitalization breakpoints
The breakpoints for capitalization ranges should be viewed only as guideposts and will change over time. In general, FTSE Russell (which maintains a number of stock-market indexes based on company size) considers small-cap stocks to have market caps of between $150 million and $7 billion, mid caps to have market caps between $7 billion and $150 billion, and large caps to be those companies with market caps above $150 billion.
Boston Partners Global Investors, Inc. (Boston Partners) is composed of three divisions, Boston Partners, Boston Partners Private Wealth, and Weiss, Peck & Greer (WPG) Partners, and is an indirect, wholly owned subsidiary of ORIX Corporation of Japan (ORIX).
8476705.1