Mullaney on the Markets
Is good news now bad news?
By Michael Mullaney | Director of Global Markets Research
Published October 2026
Stocks slipped in September with the S&P 500 Index dropping by 0.35% under the pressure of rising interest rates; 10-year Treasury yields jumped from 4.75% at the end of August to 5.29% at September’s end, the largest monthly increase since September 2022. Several factors were behind the spike in rates, including a 25-basis-point rate hike by the Federal Reserve on September 16 (the first since July 2023), a jump in the price of West Texas Intermediate crude oil from $84.06 to $90.42 after another failed attempt to end the war between the United States and Iran, little progress on lowering inflation, a robust and expanding U.S. economy, and the negative fiscal implications of President Trump’s proposal to send every American $5,000 if Republicans were to maintain a majority in the House and Senate.
Against that backdrop, the Bloomberg U.S. Aggregate Bond Index (the Agg) fell by 2.61% during the month, its largest monthly loss in four years and the declines overseas were similar: a 2.38% loss for the Bloomberg Global Aggregate Bond Index and a 3.01% drop in the MSCI EAFE Index.
Strong earnings results during the first half of the year kept the S&P 500 in positive territory for both the quarter (up 2.30%) and year-to-date period (up 12.73%) despite headwinds from the U.S. bond market; the Agg fell by 3.51% and 2.91% over those periods, respectively.
Sector returns
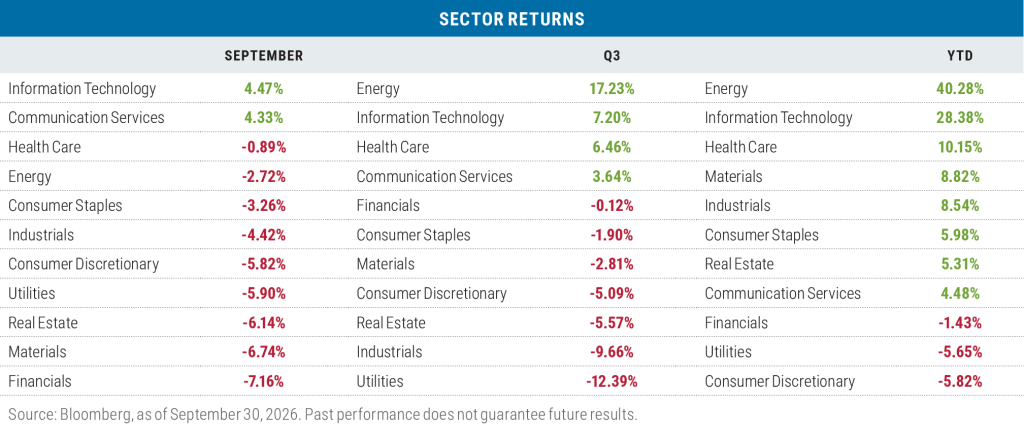
Information Technology led all sectors in September as investors gravitated back to stocks positioned to benefit from the continued artificial intelligence (AI) buildout. Three stocks led the pack: Advanced Micro Devices, Apple, and (not surprisingly) Nvidia, which collectively accounted for 60% of the sector’s return during the month.
Communication Services finished a close second, with Meta Platforms the dominant performer after a return of 26.79% during the month. During the month, the company released its new app Muse, a personal AI agent that can execute multi-step, real-world tasks across apps and websites rather than just answering questions; the release was met with early enthusiasm and quickly became one of the most downloaded apps on mobile platforms. Apple, Nvidia, and Meta helped propel the Magnificent Seven to a gain of 4.22% for the month.
Every other sector finished the month in the red, with Financials bringing up the rear; the Fed’s rate hike led to concerns that bank lending would suffer, particularly as the average rate on a 30-year mortgage loan now exceeds 7.4%. A flattening of the yield curve also stoked worries about the durability of net interest margins, a key driver of bank profitability.
For the quarter, the Energy sector was the clear-cut winner after oil jumped from $68.68 a barrel to $90.42, nearly a 32% gain, while the Utilities sector, often considered to be a bond surrogate, pulled up the rear given the pressure on rates during September.
Energy also led on a year-to-date basis, with Tech finishing second and Consumer Discretionary last through September. Tesla, with a year-to-date loss of 21.10%, was the primary culprit behind the struggles in Consumer Discretionary, and more than offset the positive contribution from Amazon, which has gained 7.94% so far this year.
Growth topped value in September, but not Q3
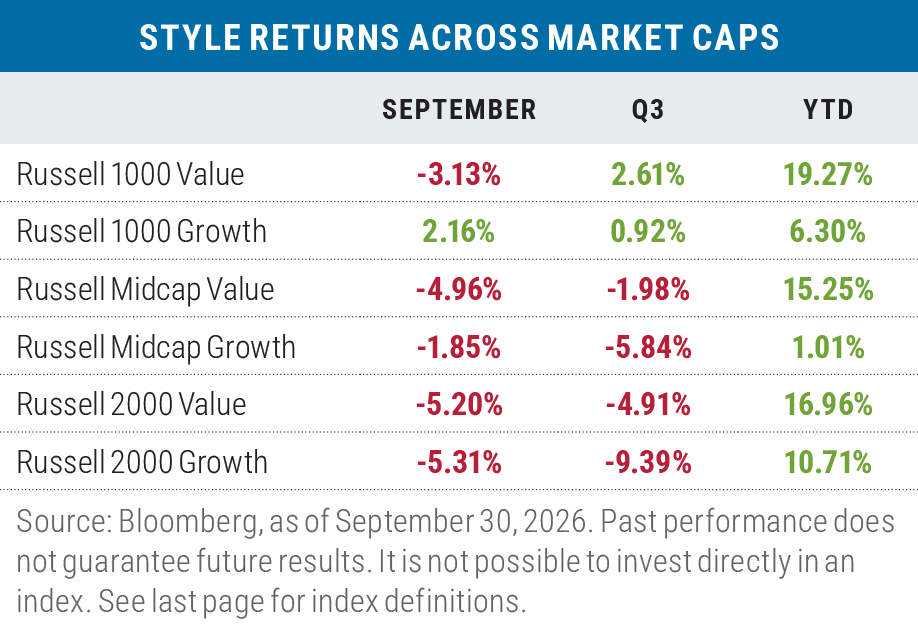
Growth led value in September among large- and mid-cap stocks, but the differential was the most pronounced at the top of the capitalization ranges, where the Russell 1000 Growth Index beat the Russell 1000 Value Index by 5.29%. The primary factor that drove the underperformance of the 1000 Value Index was the Financials sector, which fell by 7.34% during the month. While the Financials sector fell by a similar amount in the 1000 Growth Index (7.17%), the key difference was the weighting of the sector in the two indexes: 18.94% for the 1000 Value Index versus just 4.79% for the 1000 Growth Index.
While value also lagged growth in the mid-cap space, it actually outperformed growth (but still declined) among small caps during the month.
For the quarter and year to date, value maintained a sizable lead over growth across all three market capitalization ranges.
More risk off than on in September; risk on has dominated YTD
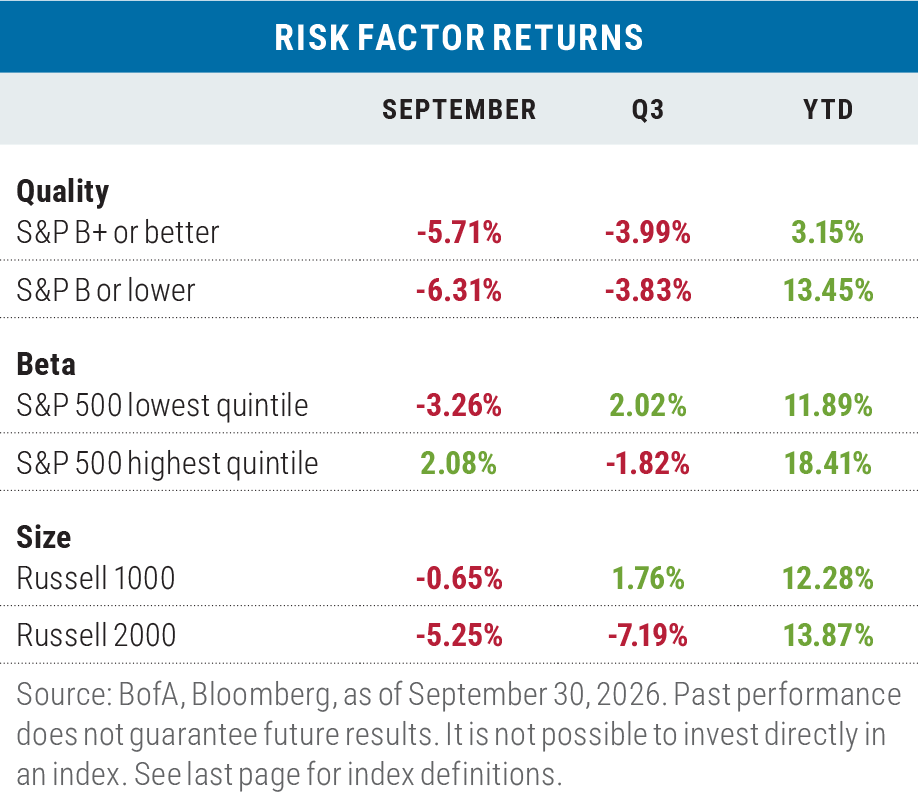
September saw the risk-off trade outperform, as high-quality and large-cap stocks led their counterparts, though high beta (risk on) led low beta primarily due to the “Big Tech” effect: Roughly 60% of the return differential between the Russell 1000 Index and the Russell 2000 Index came from the return and weight differences of the Technology sector between both benchmarks.
For the quarter, risk factors were mixed, but on a year-to-date basis, the three risk-on factors have prevailed.
Lower returns for non-U.S. stocks in September, although still solid for the YTD
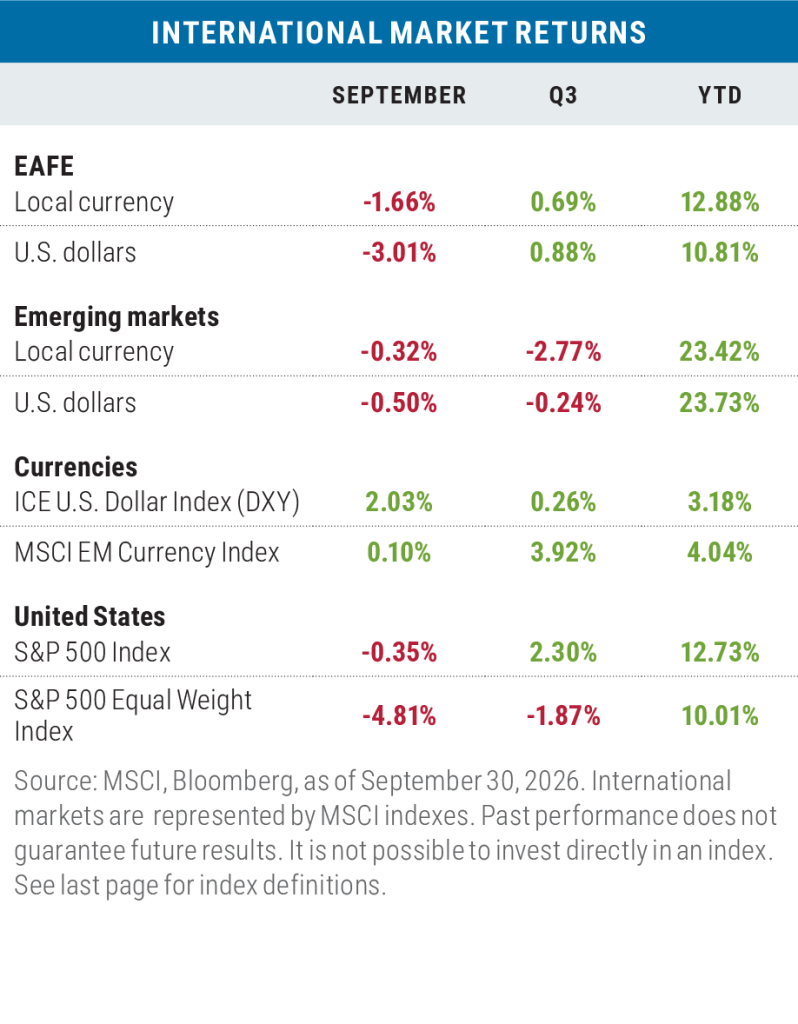
Developed-market international stocks (as measured by the MSCI EAFE Index) lagged the S&P 500 in September in both local currency and U.S. dollar (USD) terms. Returns in USD were the weaker of the two, as the basket of six foreign currencies in the DXY Index declined versus the dollar. The euro is the largest currency weighting in the DXY Index and it fell by 2.48% during September, which marked the greenback’s strongest performance versus the euro in fourteen months. The returns of emerging-market stocks were better during the month than those of developed markets (although still negative), and emerging markets slightly outpaced the S&P 500 in local currency terms.
For the quarter, the S&P 500 outperformed both developed and emerging-market stocks; the gap was most pronounced in local-currency terms for emerging markets, given the notable currency gains in EM versus the USD during the quarter.
Year to date, developed-market stocks inched ahead of the S&P 500 in local currency terms but have lagged in USD terms given the strength of the dollar, with the DXY up 3.18% YTD. Emerging-market stocks soundly outperformed the S&P 500 in both local currency and USD terms this year, but due almost exclusively to the performance of South Korea (up 96.91%) and Taiwan (up 70.70%) and their leading positions in the semiconductor industry.
Looking ahead
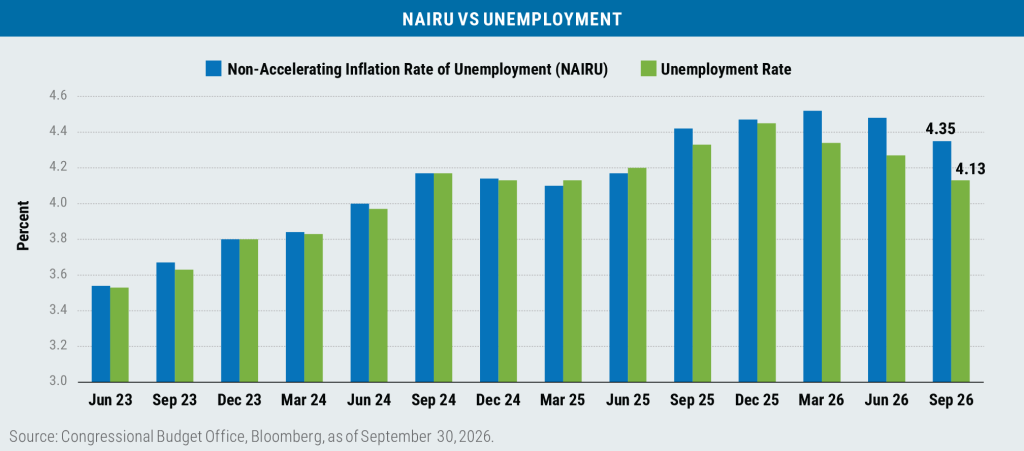
The Federal Reserve has an oft-discussed dual mandate: to promote maximum employment and stable prices. Currently, the Fed has no issues with employment, given an unemployment rate of 4.1% that is running below the Non-Accelerating Inflation Rate of Unemployment (NAIRU) calculated by the Congressional Budget Office and considered to be indicative of the level considered full employment.
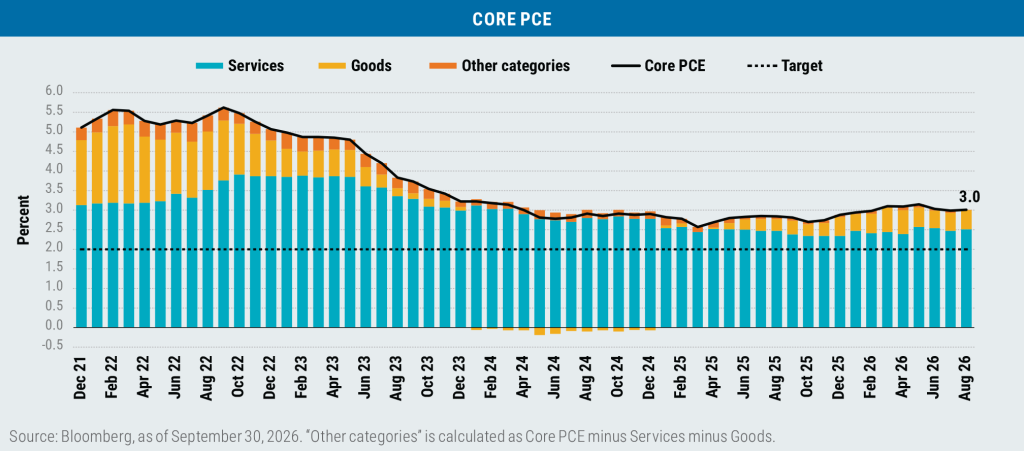
There remains a decided issue with price stability, however, as the Fed’s preferred inflation measure, the Core Personal Consumption Expenditures Price Index (Core PCE), remains roughly 100 basis points higher than the Fed’s stated 2% target.
Given full employment but persistent price pressure above the Fed’s target, Fed Chair Kevin Warsh stated after the Fed’s September 16 meeting that “we must be confident that underlying inflation is moving to our objective, clearly and at sufficient speed. Today, the FOMC decided this standard has not been satisfied.” The consensus interpretation was that more rate hikes would be forthcoming as the Fed would now focus on using monetary policy to slow economic growth in order to bring down the rate of inflation.
That’s where the good news/bad news paradox comes into play: Through September, there’s been a significant acceleration in both the manufacturing and service (more than 70% of the U.S. economy) sides of the economy, presenting a quandary for the Fed.
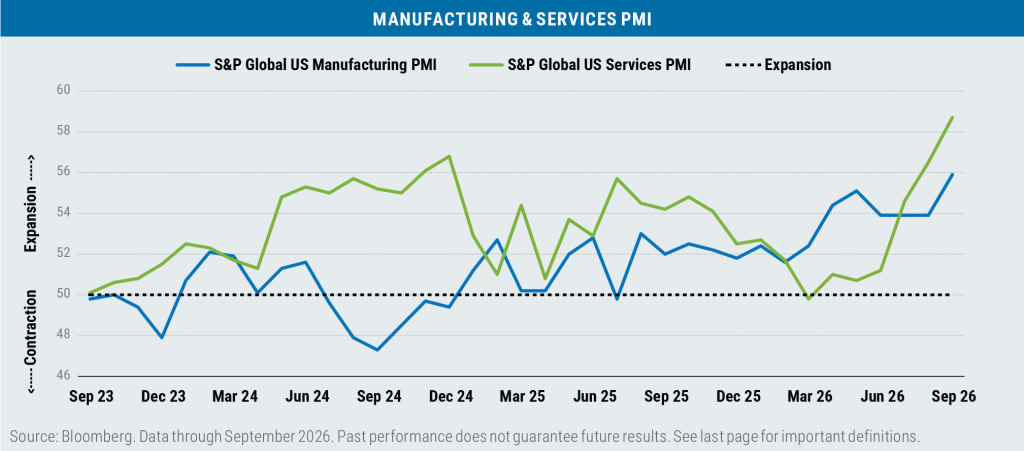
While the economy appears to be running hot (the Atlanta Fed’s GDPNow model shows an expected 3.7% growth rate for Q3), the FOMC has indicated through its Dot Plot that only one more rate hike would be necessary through 2027; bond investors evidently disagree and expect more hikes will be needed to fully quell inflation.
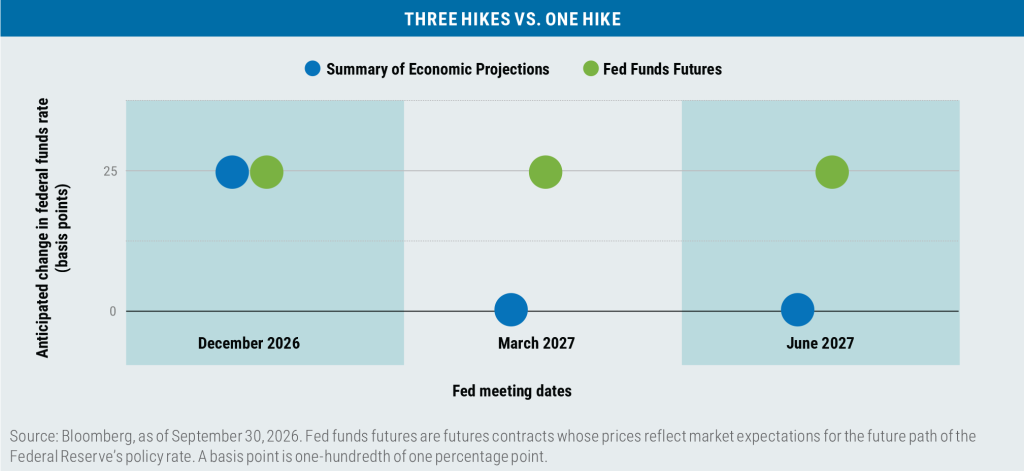
Bond investors may be on to something. As recent history shows, the Fed is never “one and done” when it embarks on a hiking cycle to curb inflation.
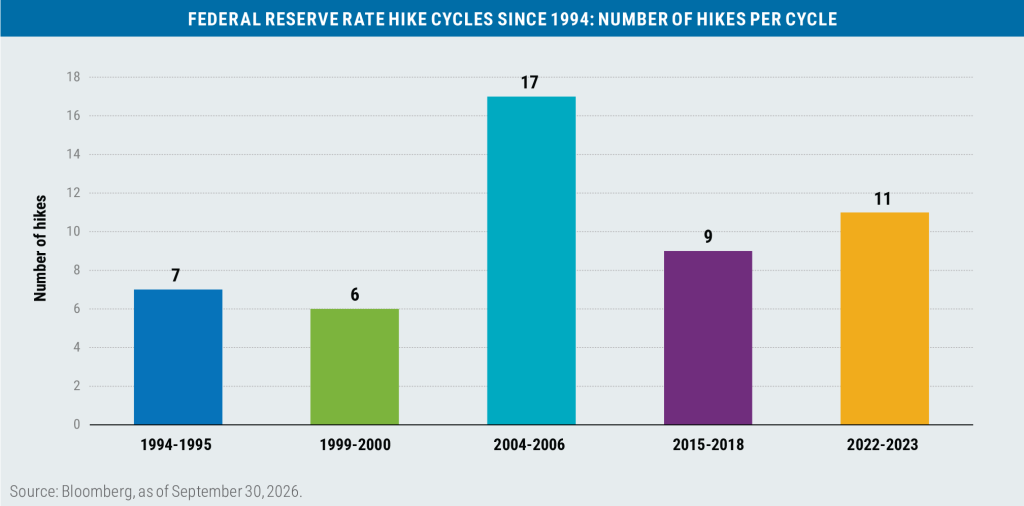
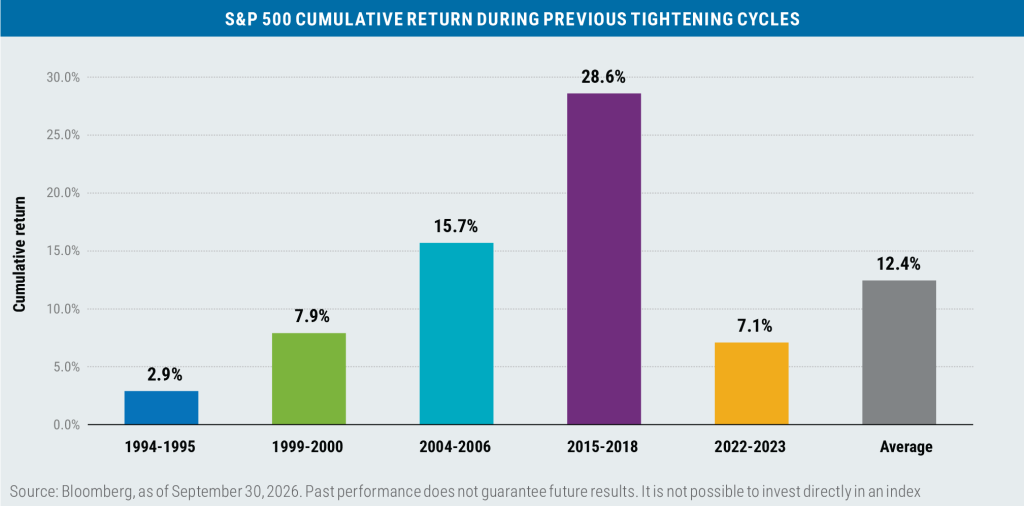
That said, Fed tightening cycles have not precluded the S&P 500 from posting further gains.
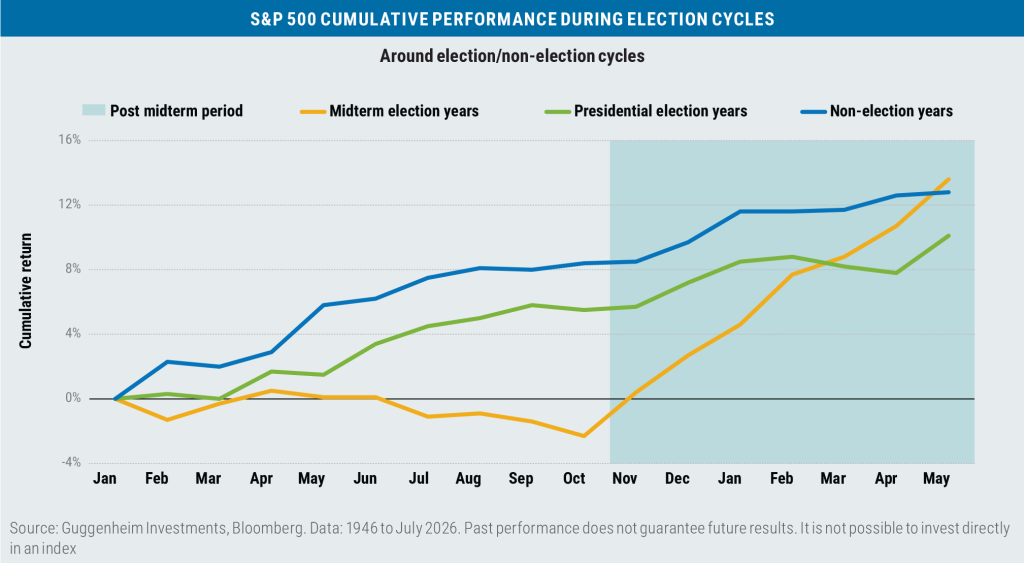
With less than 30 days to go until the midterm elections, investors should expect stock price action to remain choppy, but to gradually improve into the elections and—hopefully—thereafter.

Boston Partners Global Investors, Inc. (“Boston Partners”) is an investment adviser registered with the SEC under the Investment Advisers Act of 1940. The views expressed in this commentary reflect those of the author as of the date of this commentary. Any such views are subject to change at any time based on market and other conditions and Boston Partners disclaims any responsibility to update such views. Past performance is not an indication of future results.
Discussions of securities, market returns, and trends are not intended to be a forecast of future events or returns. You should not assume that investments in the securities identified and discussed were or will be profitable.
Important information
A basis point refers to a common unit of measure for interest rates and other percentages in finance. One basis point is equal to 1/100th of 1%, or 0.01%. Beta is a measure of a portfolio’s market risk relative to its benchmark. In general, a beta higher than 1.00 indicates a more volatile portfolio and beta lower than 1.00 indicates a less volatile portfolio in relation to its benchmark. Core PCE (Personal Consumption Expenditures) is a measure of inflation that excludes the prices of food and energy, which tend to be more volatile. The Dot Plot is a part of the Federal Reserve’s Summary of Economic Projections, released quarterly. It displays the individual projections of Federal Open Market Committee members regarding future federal funds rate levels. Fed fund futures are a type of futures contract that allows investors to hedge against future changes in the U.S. federal funds rate. The Federal Open Market Committee (FOMC) is a rotating group of 12 members of the Federal Reserve system tasked with setting and implementing monetary policy. The Federal Reserve Bank of Atlanta’s GDPNow model provides a real-time estimate of GDP growth for the current quarter based on available economic data. Gross domestic product (GDP) is the total market value of all the goods and services produced by a country and is a closely watched reflection of overall economic health. The Magnificent Seven stocks are a group of high-performing and influential companies in the U.S. stock market: Alphabet, Amazon, Apple, Meta Platforms, Microsoft, Nvidia, and Tesla. Net interest margin measures the difference between the interest income generated by banks and the interest paid to their depositors, expressed as a percentage of the bank’s interest-earning assets. The Non-Accelerating Inflation Rate of Unemployment (NAIRU) is the hypothetical level of unemployment at which inflation remains stable; if unemployment falls below this rate, inflation tends to rise, while if it is above, inflation tends to fall. The S&P Global Purchasing Managers’ Index (PMI) is a survey-based economic indicator designed to provide information regarding prevailing business conditions. The manufacturing and services surveys asks questions specific to manufacturing companies and service providers, respectively. The Summary of Economic Projections is a report released by the Federal Reserve four times a year, detailing projections from FOMC participants regarding key economic indicators such as GDP growth, unemployment rates, inflation, and the appropriate policy interest rate. West Texas Intermediate (WTI) crude is one of the more easily refined types of oil and serves as a key benchmark for oil prices. The yield curve is a graphical representation of how the yields of bonds of various maturities compare. A steep curve means that the difference in yields between short- and long-dated bonds is material; a flat curve means that yields are relatively uniform across maturities.
Index definitions
The Bloomberg Global Aggregate Bond Index tracks the performance of globally traded intermediate-term investment-grade bonds. The Bloomberg U.S. Aggregate Bond Index (Agg) tracks the performance of intermediate-term investment-grade bonds traded in the United States. The ICE U.S. Dollar Index (DXY) is used to measure the value of the dollar against a basket of six foreign currencies. The value of the index is a fair indication of the dollar’s value in global markets. The MSCI Emerging Markets (EM) Currency Index tracks the performance of emerging market currencies relative to the U.S. dollar where the weight of each currency is equal to its country weight in the MSCI Emerging Markets Index. The MSCI EAFE Index tracks the performance of large- and mid-cap equities traded across global developed markets, excluding the United States and Canada. The MSCI Emerging Markets Index tracks the performance of large- and mid-cap equities traded in global emerging markets. The Russell 1000 Index tracks the performance of the 1,000 largest companies traded in the United States. The Russell 2000 Index tracks the performance of the 2,000 smallest companies traded in the United States. The Russell 1000 Growth and Value Indexes track the performance of those large-cap U.S. equities in the Russell 1000 Index with growth and value style characteristics, respectively. The Russell 2000 Growth and Value Indexes track the performance of those small-cap U.S. equities in the Russell 2000 Index with growth and value style characteristics, respectively. The Russell Midcap Growth and Value Indexes track the performance of those mid-cap U.S. companies in the Russell 1000 Index with growth and value style characteristics, respectively. The S&P 500 Index tracks the performance of the 500 largest companies traded in the United States. The S&P 500 Equal Weight Index also tracks the performance of the 500 largest companies traded in the United States, but weights each company equally, rather than proportionally according to market cap. S&P credit ratings, which range from AAA (highest) to D (default), are assigned by S&P Global to individual companies to indicate their relative creditworthiness. The VIX, or CBOE Volatility Index, tracks expectations for future volatility of the stock market based on the prices of underlying S&P 500 Index options. It is not possible to invest directly in an index.
Market capitalization breakpoints
The breakpoints for capitalization ranges should be viewed only as guideposts and will change over time. In general, small-cap stocks are considered to have market caps of between $150 million and $7 billion, mid caps to have market caps between $7 billion and $50 billion, and large caps to be those companies with market caps above $50 billion. Boston Partners Global Investors, Inc. (Boston Partners) is composed of three divisions, Boston Partners, Boston Partners Private Wealth, and Weiss, Peck & Greer (WPG) Partners, and is an indirect, wholly owned subsidiary of ORIX Corporation of Japan (ORIX).
9019993.3