Mullaney on the Markets
Educated guesses
By Michael Mullaney | Director of Global Markets Research
Published May 2025
With President Trump and his administration softening their stance on tariffs over the course of the month, markets were able to recover most of the losses incurred following the April 2nd “Liberation Day” selloff that resulted in a drawdown of over 12% for the S&P 500 Index and a 50-basis point spike in the yield of the 10-Year U.S. Treasury Bond.
For the month, the S&P 500 dropped by 0.68% while the Bloomberg U.S. Aggregate Bond Index was able to eke out a gain of 0.39%. A strong start to the Q1 earnings season for S&P 500 companies also helped the index to trim its losses from earlier in the month.
Year to date, the S&P 500 has fallen by 4.93% while the Bloomberg U.S. Aggregate Bond Index has returned 3.18% as the probability of a U.S. recession in 2025 has increased.
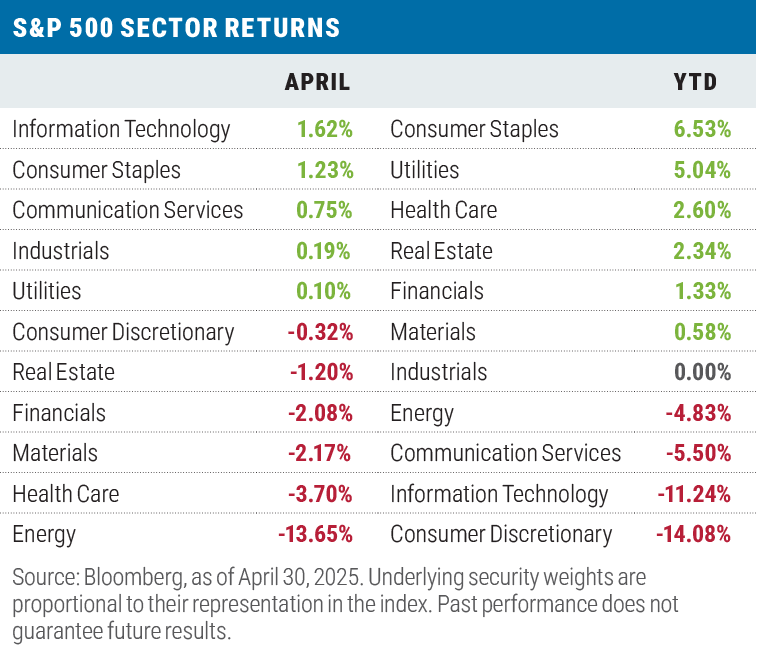
A rebound for technology in April
Information Technology, which had been the second-worst performing sector in March, led all sectors for the month of April largely on the strength of three stocks: Microsoft (up 5.29%), Broadcom (up 14.96%), and Palantir Technologies (up 40.33%). Consumer Staples, a classic defensive sector, placed second for the month and was also led by three stocks: Walmart (up 10.78%), Costco (up 5.15%), and Philip Morris (up 7.96%).
Pulling up the rear was Energy, which suffered from a precipitous price drop, particularly in oil: Crude oil prices began the month at $74.74 a barrel, but ended at $63.12. Recession fears and a pending increase in supply announced by OPEC+ leader Saudi Arabia—a tactic intended to squelch alleged quota cheating from the likes of Iraq and Kazakhstan— drove the decline1.
Year to date, defensive sectors have continued to lead, while the three home sectors to the Magnificent Seven have lagged. The Mag 7 themselves have fallen by 15.49% so far this year, while the S&P 493 (the S&P 500 Index companies excluding the Magnificent 7) has posted a loss of just 0.20%.
1 Organization of the Petroleum Exporting Countries. See important disclosures for definitions.
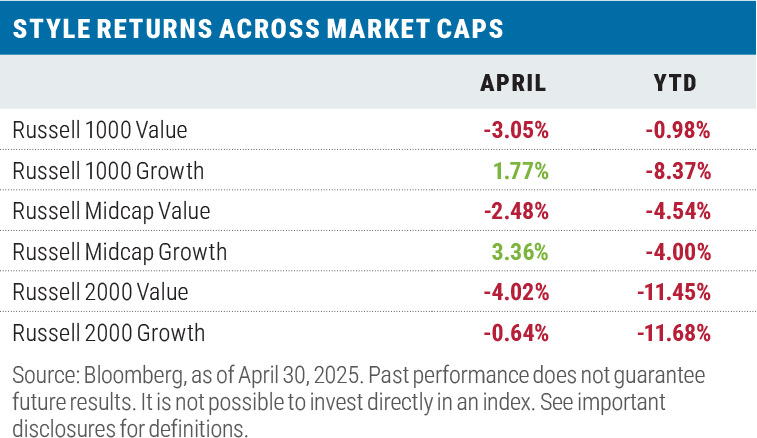
Growth also rebounds in April
Growth beat value across all three Russell market capitalization ranges (large, mid, and small) during the month with an average outperformance of 468 basis points across the three segments, though the sectors contributing to the bulk of the outperformance varied by capitalization range. For the Russell 1000 Growth Index it was Health Care, which beat its Russell 1000 Value counterpart by 1.18%. For the Russel Midcap Growth Index it was Information Technology, which beat its value counterpart by 2.00%. And for the Russell 2000 Growth Index, it was Energy, beating that sector in the Russell 2000 Value Index by 0.26%.
Year to date, value beat growth by an average of 236 basis points across the three Russell capitalization ranges, with the Russell 1000 Value Index maintaining a commanding lead of 7.39% over the Russell 1000 Growth Index. The Russell 1000 Growth Index has suffered since mid-February from its exposure to the Mag 7, which represent 54% of that index and are responsible for 96% of the index’s underperformance to date.
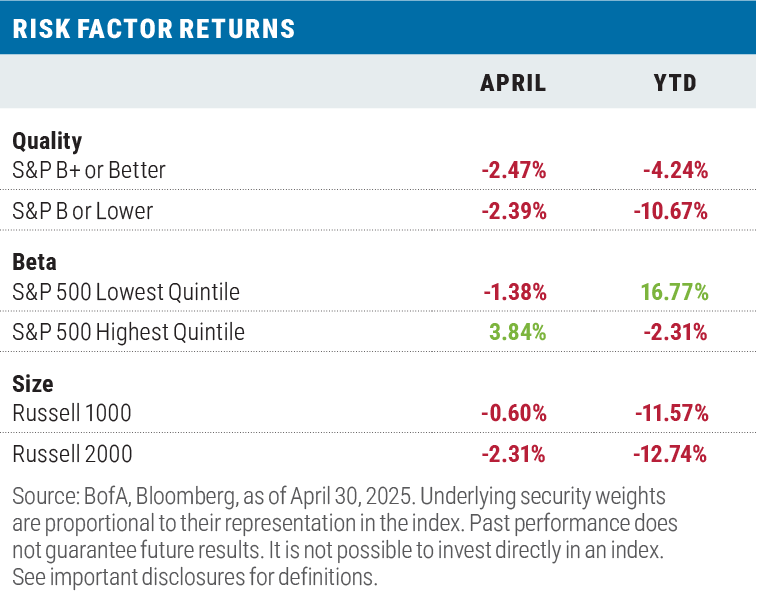
Risk factors were mixed in April, while the risk-off trade has dominated YTD
In terms of quality, low-quality stocks inched past their high-quality counterparts during the month, while high beta beat low beta. Size wise, large caps led small caps with the Russell 1000 Index beating the Russell 2000 Index. When taken together, the factor returns help to explain how Information Technology was able to rebound in April.
Year to date, risk-off factors have continued to lead in terms of quality, beta, and size.
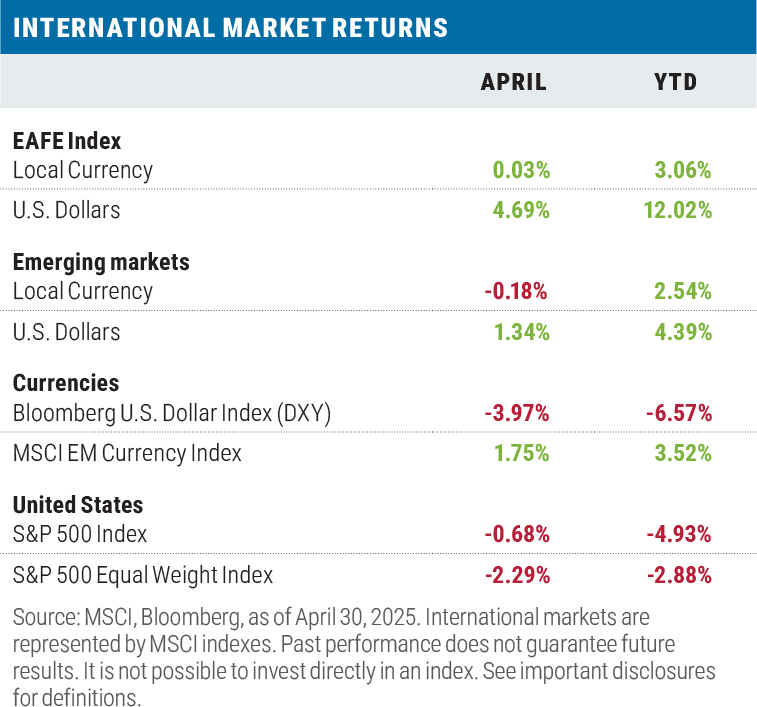
Non-U.S. stocks continued to outperform
Developed- and emerging-market stocks outperformed the S&P 500 in local currency terms during April. In U.S. dollar terms, the returns were even better, as the USD continued to give ground versus a basket of ten major foreign currencies and the MSCI EM Currency Index. April marks the third month in a row that international market returns have surpassed domestic returns in dollar terms.
Year to date, international stocks continued to maintain their lead over domestic stocks in both local currency and USD terms.
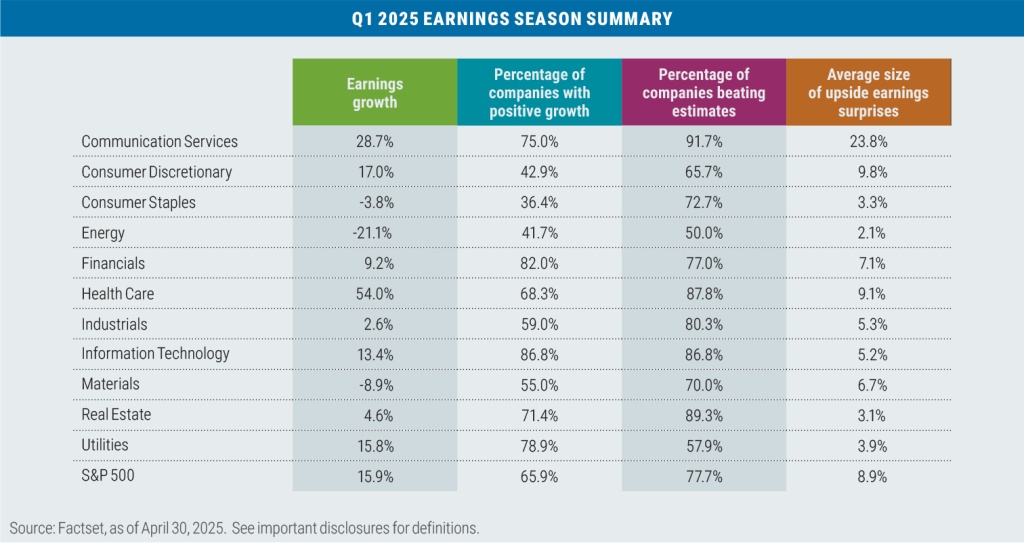
A strong start to the Q1 2025 earnings season
Through May 1, 72% of companies in the S&P 500 had reported results for the first quarter of the year. Year-over-year EPS growth came in at 15.9% on average, with almost two-thirds of the companies reporting positive growth. Some 77% of the companies reporting beat analyst expectations with an average upside earnings surprise of 8.9%.
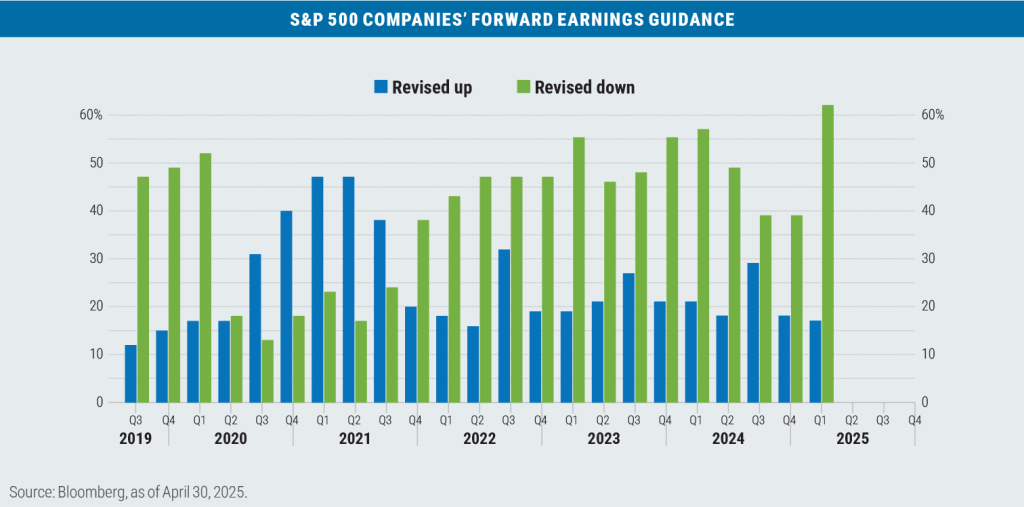
While actual results were encouraging, the forward guidance was not, as more S&P 500 Index members cut earnings guidance during the first quarter than at any time in the past ten years, largely due to potential tariff impacts.
Looking ahead: taxes and spending in focus
President Trump’s announcement on April 9 of a 90-day moratorium on reciprocal tariffs that had targeted some 75 U.S. trading partners helped to reduce the high level of uncertainty and anxiety that had developed among investors regarding U.S. trade policies. While a 10% universal tariff for all imports currently remains in place, it now seems likely that individual trade deals on a country-by-country and product-by-product basis will prevail. How China and the European Union will be treated remains to be seen.
The non-partisan Tax Foundation estimates that a 10% universal tariff would raise $2.2 trillion in revenue over the 2025 through 2034 budget window, it’s also expected to reduce GDP by 0.4 percent annually. Foreign tariff retaliation would likely trim upwards of another $300 billion of revenue, leaving an estimate of $1.7 trillion tariff revenue generated, all in. Reciprocal tariffs are a major wild card and won’t be known until the end of the 90-day moratorium on July 31, if at all.
The Tax Foundation also estimates that extending the expiring 2017 Tax Cuts and Jobs Act (TCJA) alone would cost $4.5 trillion over the next 10-years in lost revenue, so in order to remain deficit neutral, some of the tax cuts would need to expire before the end of the 10-year window, and/or significant spending cuts in non-mandatory budget line items will be required.
For next year’s fiscal budget, President Trump would like to pass “one big, beautiful bill” that would extend the TCJA tax cuts, but also incorporate eliminating taxes on tips, overtime pay, and social security payments, while increasing the cap on state and local tax (SALT) deductions.
On April 5, Senate Republicans narrowly passed a budget resolution after an all-night voting session. The blueprint authorizes $5 trillion in total tax cuts, including $1.5 trillion in new reductions and a call to raise the debt ceiling by $5 trillion. Back in February, the House passed its own blueprint that proposed $4.5 trillion in tax cuts, a $4 trillion increase in the debt limit, and approximately $2 trillion in budget cuts.
Meanwhile, back in January, Elon Musk announced that his Department of Government Efficiency (DOGE) initiative would find upwards of $2 trillion in government efficiency savings, though by March that estimate had been trimmed to $1 trillion. Through the end of April, DOGE had reported savings of just $160 billion.
Bottom line: Investors should not expect any meaningful reduction in the nation’s fiscal deficit to unfold. Finding spending cuts to help balance the budget will be a significant obstacle. Medicaid, often considered to be sacrosanct, may find its way to the chopping block if tariffs do not do the trick.
The odds of recession have increased, but a downturn is far from inevitable
John Williams, the president and chief executive officer of the Federal Reserve Bank of New York, estimates that if the April 2 tariff proposals were to stand, from 2025 to 2026 GDP would fall to less than 1%, inflation (CPI) would increase to between 3.5% and 4.00% (from 2.4% currently) and the unemployment rate would rise to between 4.5% and 5.0% (4.2% currently).
While the likelihood of the U.S. entering a recession in 2025 has doubled to 40% since January, two recession models we follow are still signaling no imminent recession risk. The first, the National Bureau of Economic Research (NBER, the official arbiter of U.S. recessions) is showing only three of its six economic indicators in negative territory and each just slightly so. For the NBER to declare a U.S. recession, all six would need to be deeply negative. Secondly, the Chicago Federal Reserve’s National Business Activity Index (which tracks some 85 economic indicators) currently stands at -0.21 on a 3-month moving average basis. Historically, the index wouldn’t typically signal a recession until falling to -0.70 or below.
While many economists and economic models had predicted a recession in the U.S. in 2022 due to the rapid succession of rate hikes by the Federal Reserve and the inversion of the yield curve, neither of these two models produced such a forecast.
In their March “Summary of Economic Projections,” the board members of the Federal Reserve signaled that two 25-basis points cuts by year-end 2025 were on the table, but as of April 30, fed funds futures were pricing in four rate cuts by December, largely due to the economic dampening effect tariffs are forecasted to produce. Investors will have to wait until the June Fed meeting to see if the members concur with what the market is pricing in for rate cuts.
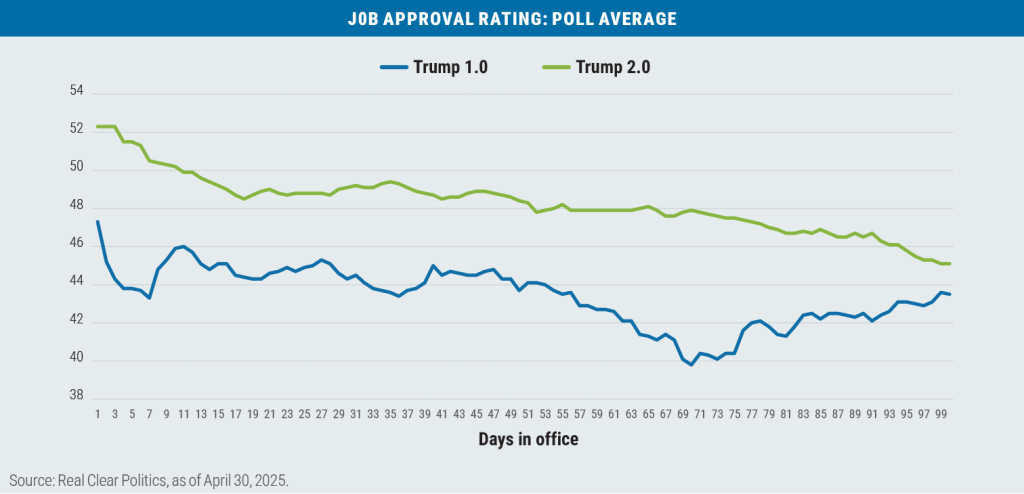
President Trump’s first 100 days
During President Trump’s first term in office, the media reported that he watched two metrics as an indication of how his presidency was going: his approval rating and the performance of the stock market as measured by the S&P 500. While President Trump’s approval rating fell over the first 100 days of both of his terms, in his first term it had begun to recover by day 70. In his second term, there has been no such recovery so far:
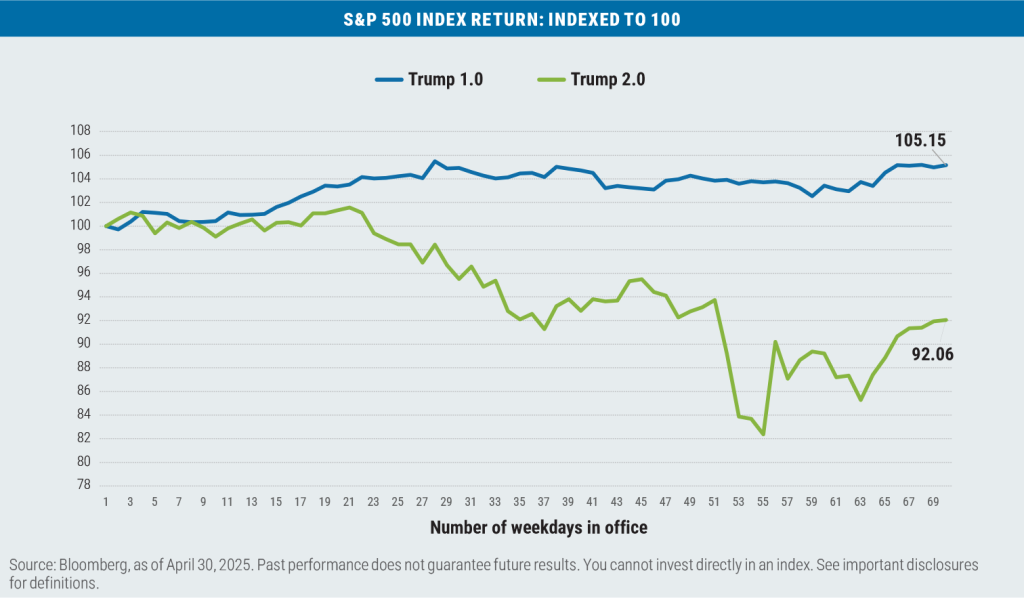
Nor has the stock market faired well for Trump over the first 100 days (70 trading days) of his second term, dropping by 7.94% versus a gain of 5.15% for the S&P 500 during Trump’s first turn in office.
In conclusion
Where the economy and markets go from here is anybody’s guess, but hopefully an educated one. Pessimists may be inclined to quote Vanguard founder Jack Bogle when he was asked this question in a Forbes Magazine article in 2008 what the best financial lesson he’d ever learned was. His answer: “I guess the best financial lesson I’ve ever learned was about investing, as distinct from finance. I was a runner in a brokerage firm in 1951, and an old runner with me said, ‘Bogle, the only thing you need to know is that nobody knows nothing.’”

Important disclosures
Boston Partners Global Investors, Inc. (“Boston Partners”) is an investment adviser composed of two divisions, Boston Partners and Weiss, Peck & Greer Partners (“WPG”), and is an indirect, wholly owned subsidiary of ORIX Corporation of Japan (“Orix”). Boston Partners is affiliated with listed corporations through common ownership. ORIX Corporation Europe, N.V. services may be offered in the U.S. through Robeco Institutional Asset Management, U.S.
Boston Partners Global Investors, Inc. (“Boston Partners”) is an investment adviser registered with the SEC under the Investment Advisers Act of 1940. The views expressed in this commentary reflect those of the author as of the date of this commentary. Any such views are subject to change at any time based on market and other conditions and Boston Partners disclaims any responsibility to update such views. Past performance is not an indication of future results.
Discussions of securities, market returns, and trends are not intended to be a forecast of future events or returns. You should not assume that investments in the securities identified and discussed were or will be profitable.
Terms and definitions
Beta is a measure of a portfolio’s market risk relative to its benchmark. In general, a beta higher than 1.00 indicates a more volatile portfolio and beta lower than 1.00 indicates a less volatile portfolio in relation to its benchmark. The Bloomberg U.S. Aggregate Bond Index tracks the performance of intermediate-term investment-grade bonds traded in the United States. The Bloomberg U.S. Dollar Index (DXY) is used to measure the value of the dollar against a basket of six foreign currencies. The value of the index is a fair indication of the dollar’s value in global markets. The Consumer Price Index is a commonly used measure of inflation that tracks the variation in prices paid by typical consumers for retail goods and other items. The Magnificent Seven stocks are a group of high-performing and influential companies in the U.S. stock market: Alphabet, Amazon, Apple, Meta Platforms, Microsoft, NVIDIA, and Tesla. The MSCI Emerging Markets (EM) Currency Index tracks the performance of emerging market currencies relative to the U.S. dollar where the weight of each currency is equal to its country weight in the MSCI Emerging Markets Index. The MSCI EAFE Index tracks the performance of large- and mid-cap equities traded across global developed markets, excluding the United States and Canada. The MSCI Emerging Markets Index tracks the performance of large- and mid-cap equities traded in global emerging markets. The Organization of the Petroleum Exporting Countries (OPEC) is an alliance of 12 oil-producing and exporting countries designed to influence the global supply of petroleum and maximize profits. The plus designation includes an additional 10 countries that also follow OPEC policies. The Russell 1000 Index tracks the performance of the 1,000 largest companies traded in the United States. The Russell 2000 Index tracks the performance of the 2,000 smallest companies traded in the United States. The Russell 1000 Growth and Value Indexes track the performance of those large-cap U.S. equities in the Russell 1000 Index with growth and value style characteristics, respectively. The Russell 2000 Growth and Value Indexes track the performance of those small-cap U.S. equities in the Russell 2000 Index with growth and value style characteristics, respectively. The Russell Midcap Growth and Value Indexes track the performance of those mid-cap U.S. companies in the Russell 1000 Index with growth and value style characteristics, respectively. The S&P 500 Index tracks the performance of the 500 largest companies traded in the United States. The S&P 500 Equal Weight Index also tracks the performance of the 500 largest companies traded in the United States, but weights each company equally, rather than proportionally according to market cap. S&P credit ratings, which range from AAA (highest) to D (default), are assigned by S&P Global to individual companies to indicate their relative creditworthiness. It is not possible to invest directly in an index.
Market capitalization breakpoints
The breakpoints for capitalization ranges should be viewed only as guideposts and will change over time. In general, FTSE Russell (which maintains a number of stock-market indexes based on company size) considers small-cap stocks to have market caps of between $150 million and $7 billion, mid caps to have market caps between $7 billion and $150 billion, and large caps to be those companies with market caps above $150 billion.
7813600.1