Mullaney on the Markets
Despite risks, stock returns remain resilient
By Michael Mullaney | Director of Global Markets Research
Published February 2026
Despite the threat of a U.S. military strike on Iran, the deaths of two ICE protestors in Minnesota, and a partial government shutdown, stocks were able to overcome a 2.59% intra-month drawdown to finish the month with a 1.44% gain, the ninth consecutive month of positive returns for the S&P 500 Index.
The bond market also snuck into positive territory during the month, with the Bloomberg U.S. Aggregate Bond Index gaining a scant 0.11%; coupon income was needed to offset price losses for securities along several segments of the yield curve and tip bonds into the black for January. As was widely expected, the Federal Reserve held interest rates steady at their January 28 meeting.
In their accompanying prepared statement, the Fed removed language citing unemployment risks, noted that economic activity had been expanding at a solid pace, and repeated that inflation remained somewhat elevated, all of which served as reasons for staying pat on rates.
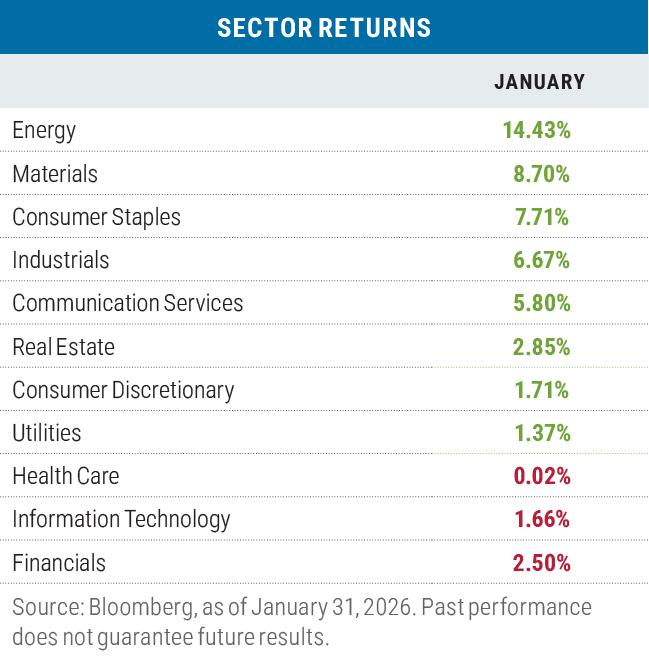
Sector returns in January
The threat of supply disruption due to tensions in the Middle East drove the price of Brent crude oil jump from $60.85 a gallon at the beginning of the month to $70.69 by its end, the largest monthly increase since July 2023. Oil service companies had strong gains (Schlumberger: +26.06%) on the anticipation they will play a significant role in upgrading Venezuelan oil production going forward.
The Materials sector return was helped in turn by specialty chemical companies (Albemarle: +20.64%, CF Industries: +20.55%) that produce products utilized in the energy space.
In the Financials sector, companies that have large credit card businesses were hard hit by the Trump administration’s threat of capping credit card interest rates charges at 10%. The current average interest rate charged on credit card balances is upwards of 22%.
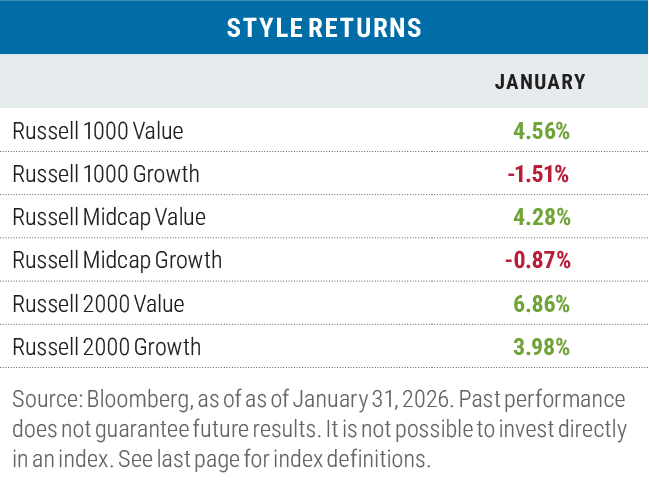
Value surges in January, growth hurt by tech names
Value outperformed growth for a third consecutive month in January by an average of 4.70% when measured across the Russell’s three capitalization ranges, representing the best combined monthly performance for value since July 2024 and the best combined performance for value over a three-month period since May 2022.
The Information Technology sector was once again responsible for the bulk of the large-cap value outperformance, gaining 8.34% in the value benchmark versus the 4.28% loss for the sector in the Russell 1000 Growth Index. Software companies that are thought to be vulnerable to artificial intelligence (AI) disruption were particularly hard hit (Salesforce: -19.86%;
ServiceNow: -23.62%; Workday: -18.23%).
During the month, the Magnificent 7 gained 0.55% while the “S&P 493” returned 1.97% as investors continued to diversify their exposures.
The Information Technology sector also led to performance disparities in the mid-cap space: the tech sector in the Russell Midcap Value Index returned 5.20% for the month versus a loss of 7.81% for the sector in the Russell Midcap Growth Index.
In small caps, cyclical sectors had strong performance in both growth and value, except, once again, for the technology sector, which in the Russell 2000 Growth Index dropped by 2.24% during the month versus a gain of 13.51% in the Russell 2000 Value Index.
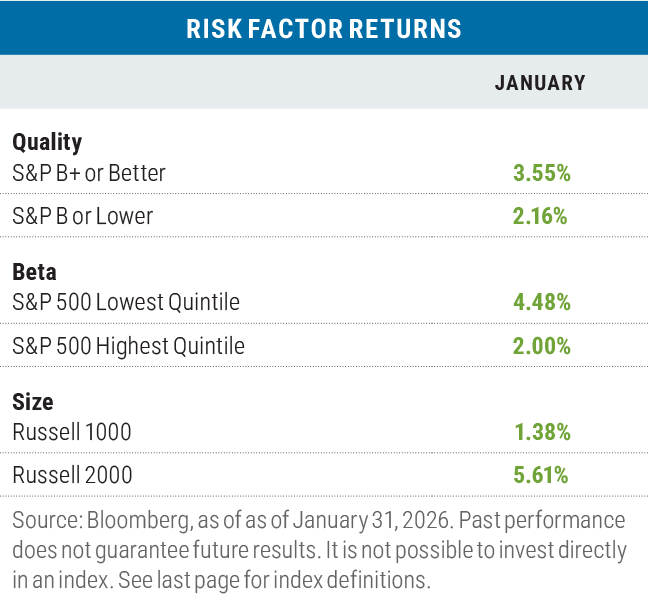
More risk off than risk on in January
In January, the risk-off characteristics of high quality and low beta outperformed, while the risk-on characteristic of small size beat the large size factor. Within the Russell 1000 Index, the smallest capitalization quintile returned 2.91% while the largest capitalization quintile gained 1.10%.
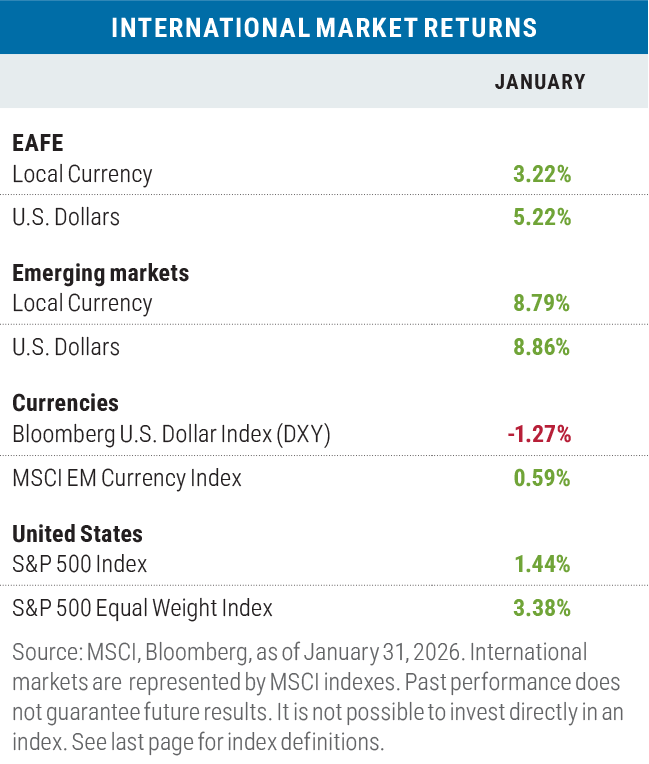
International stocks post strong gains again
Developed market stocks (as represented by the MSCI EAFE Index) did well in January in local currency terms and particularly well in U.S. dollar (USD) terms as the dollar once again depreciated against the basket of currencies included in the Bloomberg DXY Dollar Index. In terms of specifics, the Australian dollar, the Indian rupee, the British pound, and the Euro were the strongest performers against the dollar.
Emerging market stocks had their best relative performance versus the S&P 500 since November 2022 as Columbia, Peru, and South Korea produced gains of nearly 30% during the month. Signs of a global cyclical recovery was the rising tide that lifted many emerging market boats.
Looking ahead
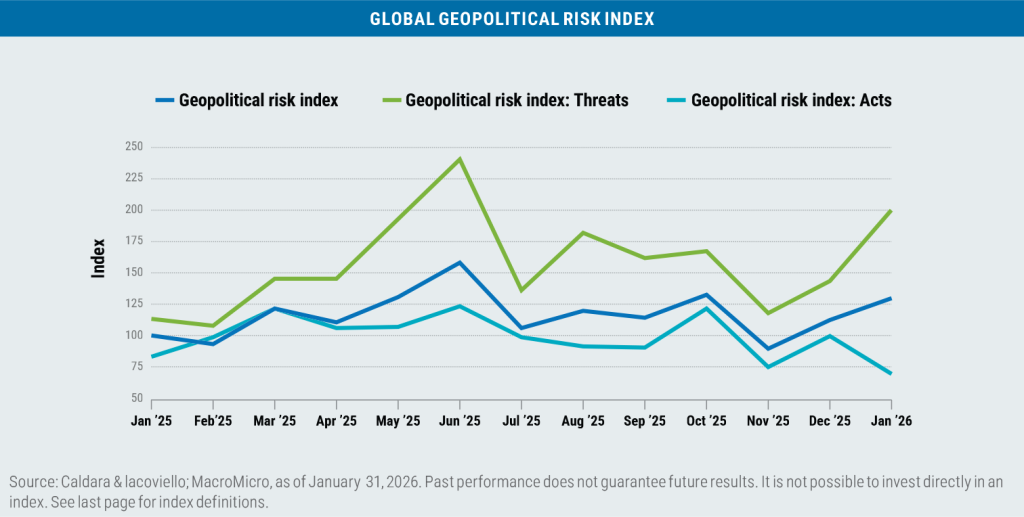
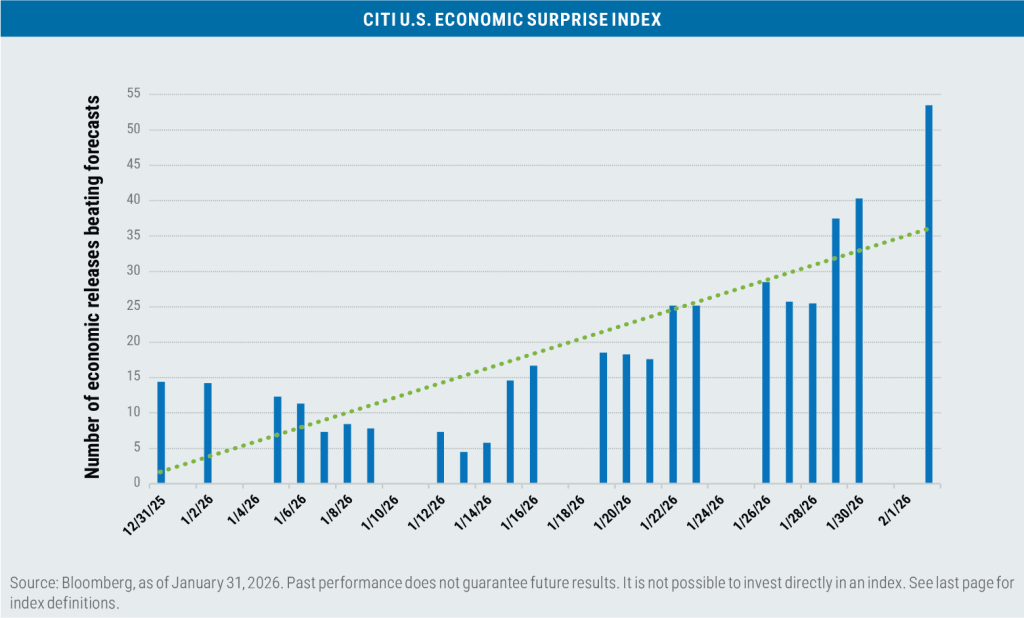
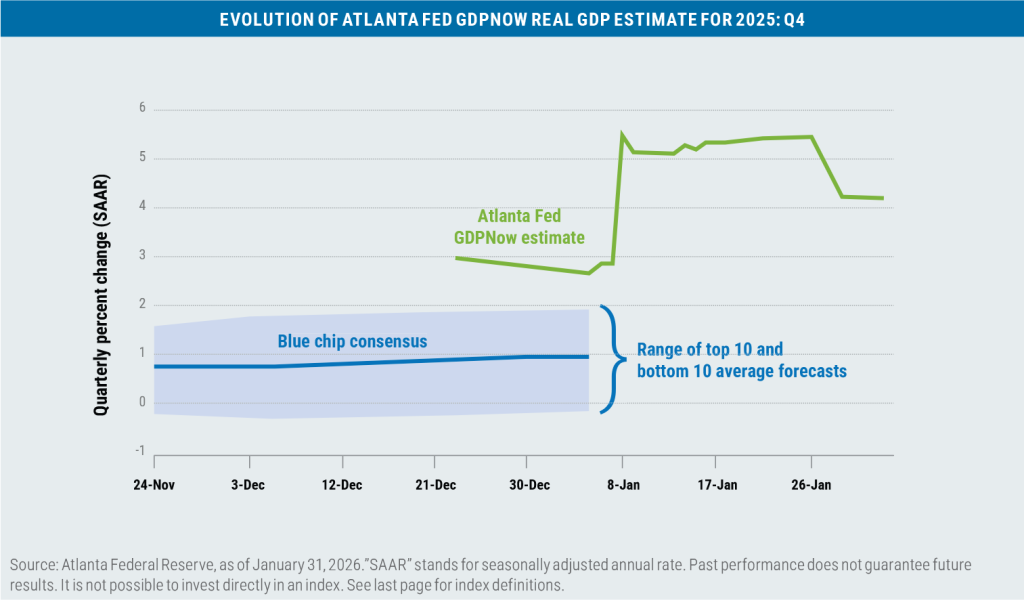
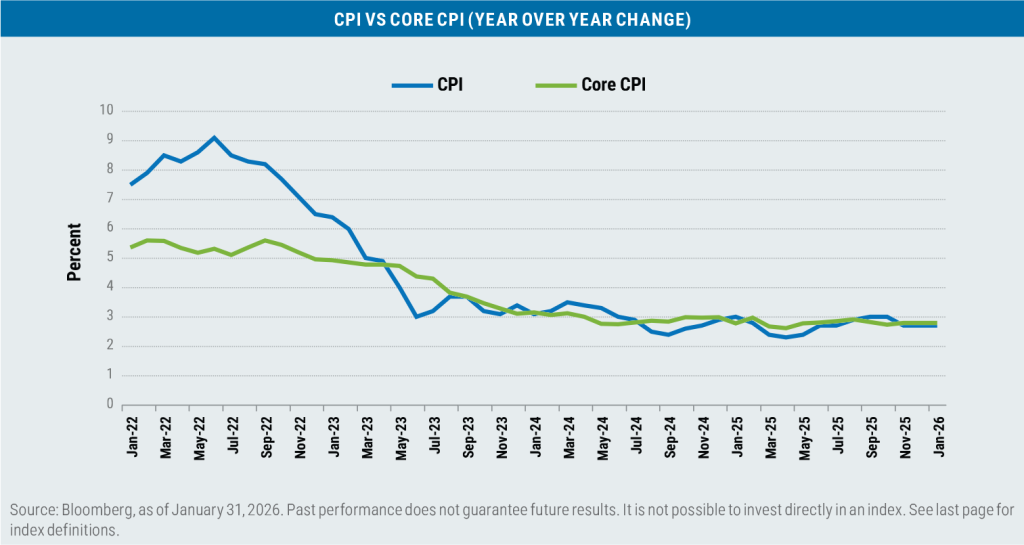
While geopolitical risk remains elevated, investors seem to be focusing on the strength of the U.S. economy, moderating inflation, and earnings results and forecasts, all of which remain encouraging.
Hopefully history will repeat itself in 2026!

Boston Partners Global Investors, Inc. (“Boston Partners”) is an investment adviser registered with the SEC under the Investment Advisers Act of 1940. The views expressed in this commentary reflect those of the author as of the date of this commentary. Any such views are subject to change at any time based on market and other conditions and Boston Partners disclaims any responsibility to update such views. Past performance is not an indication of future results.
Discussions of securities, market returns, and trends are not intended to be a forecast of future events or returns. You should not assume that investments in the securities identified and discussed were or will be profitable.
Important information
Beta is a measure of a portfolio’s market risk relative to its benchmark. In general, a beta higher than 1.00 indicates a more volatile portfolio and beta lower than 1.00 indicates a less volatile portfolio in relation to its benchmark. The Caldara and Iacoviello Geopolitical Risk (GPR) Index tracks the number of articles related to adverse geopolitical events in ten newspapers each month (as a share of the total number of news articles). The results are organized into eight categories: War Threats (Category 1), Peace Threats (Category 2), Military Buildups (Category 3), Nuclear Threats (Category 4), Terror Threats (Category 5), Beginning of War (Category 6), Escalation of War (Category 7), and Terror Acts (Category 8). The Geopolitical Threats (GPRT) Index includes words belonging to categories 1 to 5 above; the Geopolitical Acts (GPRA) Index includes words belonging to categories 6 to 8. The Citigroup U.S. Economic Surprise Index is constructed using weighted historical standard deviations of surprises (the difference between actual releases and Bloomberg surveys) for a basket of different macroeconomic indicators. The Consumer Price Index (CPI) is a commonly used measure of inflation that tracks the variation in prices paid by typical consumers for retail goods and other items. Core CPI excludes the more volatile food and energy segments. The Federal Reserve Bank of Atlanta’s GDPNow model provides a real-time estimate of GDP growth for the current quarter based on available economic data. Gross domestic product (GDP) is the total market value of all the goods and services produced by a country and is a closely watched reflection of overall economic health. ICE is the U.S. Immigration and Customs Enforcement agency.
Index definitions
The Bloomberg U.S. Aggregate Bond Index tracks the performance of intermediate-term investment-grade bonds traded in the United States. The Bloomberg U.S. Dollar Index (DXY) is used to measure the value of the dollar against a basket of six foreign currencies. The value of the index is a fair indication of the dollar’s value in global markets. The Magnificent Seven stocks are a group of high-performing and influential companies in the U.S. stock market: Alphabet, Amazon, Apple, Meta Platforms, Microsoft, Nvidia, and Tesla. The MSCI Emerging Markets (EM) Currency Index tracks the performance of emerging market currencies relative to the U.S. dollar where the weight of each currency is equal to its country weight in the MSCI Emerging Markets Index. The MSCI EAFE Index tracks the performance of large- and mid-cap equities traded across global developed markets, excluding the United States and Canada. The MSCI Emerging Markets Index tracks the performance of large- and mid-cap equities traded in global emerging markets. The Russell 1000 Index tracks the performance of the 1,000 largest companies traded in the United States. The Russell 2000 Index tracks the performance of the 2,000 smallest companies traded in the United States. The Russell 1000 Growth and Value Indexes track the performance of those large-cap U.S. equities in the Russell 1000 Index with growth and value style characteristics, respectively. The Russell 2000 Growth and Value Indexes track the performance of those small-cap U.S. equities in the Russell 2000 Index with growth and value style characteristics, respectively. The Russell Midcap Growth and Value Indexes track the performance of those mid-cap U.S. companies in the Russell 1000 Index with growth and value style characteristics, respectively. The S&P 500 Index tracks the performance of the 500 largest companies traded in the United States. The S&P 500 Equal Weight Index also tracks the performance of the 500 largest companies traded in the United States, but weights each company equally, rather than proportionally according to market cap. The S&P 493 is not an official index, but reflects the performance of the S&P 500 excluding the Magnificent Seven. S&P credit ratings, which range from AAA (highest) to D (default), are assigned by S&P Global to individual companies to indicate their relative creditworthiness. It is not possible to invest directly in an index.
Market capitalization breakpoints
The breakpoints for capitalization ranges should be viewed only as guideposts and will change over time. In general, FTSE Russell (which maintains a number of stock-market indexes based on company size) considers small-cap stocks to have market caps of between $150 million and $7 billion, mid caps to have market caps between $7 billion and $150 billion, and large caps to be those companies with market caps above $150 billion.
Boston Partners Global Investors, Inc. (Boston Partners) is composed of three divisions, Boston Partners, Boston Partners Private Wealth, and Weiss, Peck & Greer (WPG) Partners, and is an indirect, wholly owned subsidiary of ORIX Corporation of Japan (ORIX).
8760837.1