Mullaney on the Markets
The beat goes on
By Michael Mullaney | Director of Global Markets Research
Published November 2025
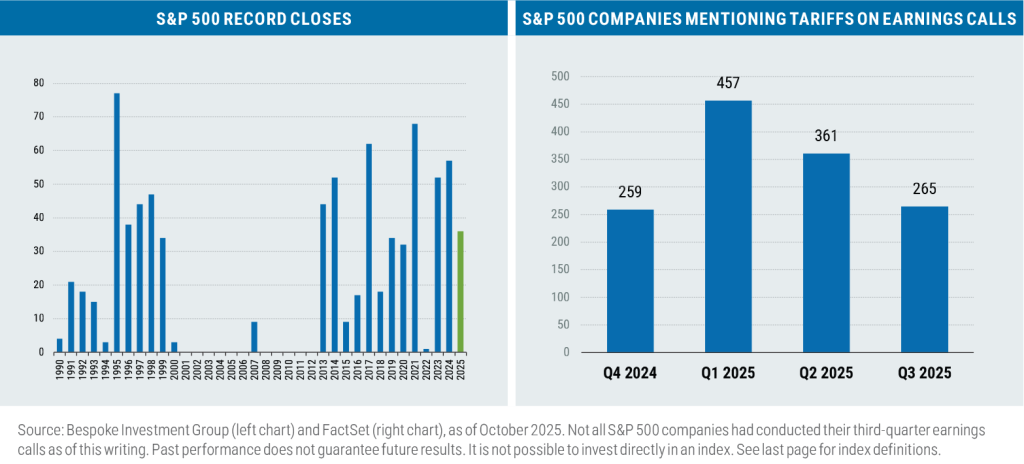
The S&P 500 Index advanced by 2.34% in October, recording its sixth consecutive monthly gain (a feat that was last accomplished in January 2007); the index has hit 36 record highs so far in 2025. The S&P was buoyed by a strong start to the Q3 earnings season, reduced tariff tensions, and a second consecutive interest rate cut by the Federal Reserve.
The continued rally in October was despite the federal government entering its 34th day of a shutdown as of this writing.
Although the Fed cut rates by 25 basis points on October 29, bond returns were somewhat muted with the Blomberg U.S. Aggregate Bond Index gaining a scant 0.63% for the month: Interest rates dropped by an average of just five basis points for U.S. Treasury securities with maturities ranging from three months to 30 years as investors continued to grapple with how many rate cuts are likely to follow the October reduction.
For the year, the S&P 500 is now up by 17.50% and the Bloomberg U.S. Aggregate Index has returned 6.80%.

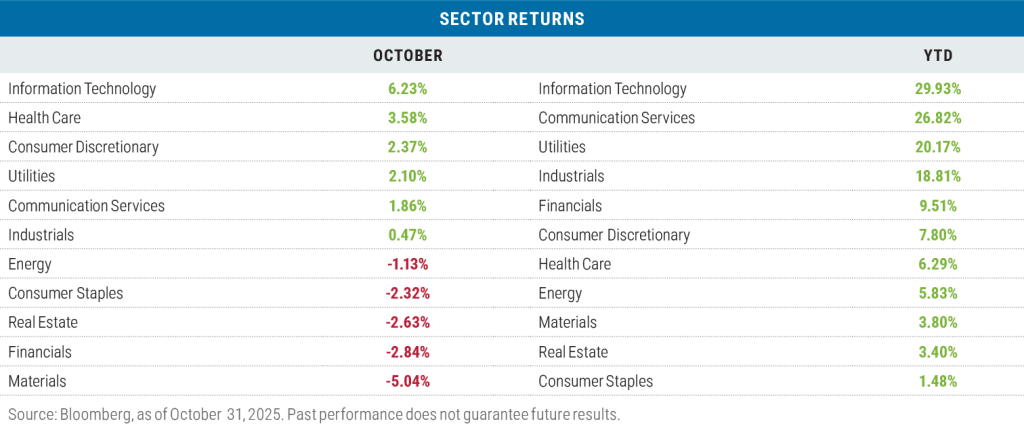
Sector returns in October: Six positives, five negatives
Information Technology led all sectors in October, largely on the strength of semiconductor stocks, which continued to benefit from an almost insatiable demand for artificial intelligence (AI) related chips. Nvidia, Broadcom, Advanced Micro Devices, and Micron Technology alone were responsible for 64% of the sector’s return.
Apple (+6.18%) also had a positive impact on the tech sector’s performance during the month with a quarterly report that beat consensus expectations on both revenue and earnings. The company also issued positive guidance related to the release of the recent iPhone 17.
Health Care, which had been the lowest-returning sector through September, rebounded during October with broad-based strength across pharmaceuticals, medical devices, and healthcare insurers.
Three cyclical sectors (Materials, Financials, and Real Estate) lagged during the month as investors began to question how many more rate cuts by the Fed would be needed to keep the economy on track while also keeping inflation at bay—and whether the Fed would be willing to move at all with the government shutdown causing an economic data vacuum.
Year to date, Information Technology and Communication Services continued to lead all sectors of the S&P 500. Five out of the seven Magnificent 7 reside in those two sectors, with Nvidia, Microsoft, Apple, Alphabet, and Meta responsible for 43% of the overall return of the S&P 500 and 27% of the index weight.
The Consumer Staples sector has, not surprisingly, lagged year-to-date as the sector is one of the most exposed to tariffs. Goldman Sachs has estimated that tariffs will reduce the sector’s profit margin by upwards of 0.50%. At 6.50% on average, Consumer Staples has the lowest net profit margin of any of the eleven sectors comprising the S&P 500.
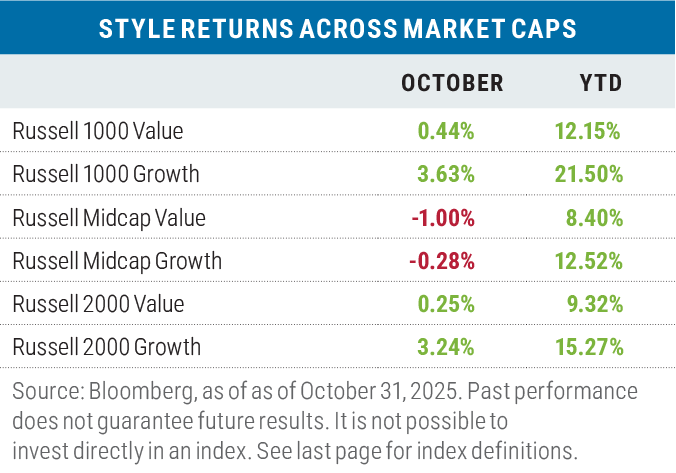
Once again, growth leads value
During the month, growth beat value by an average of 2.30% when measured across the three capitalization ranges of the major Russell benchmarks, though the biggest return differential was found in the large-cap space where the Russell 1000 Growth Index outperformed the Russell 1000 Value Index by 3.19%.
While in months prior, the outperformance of large-cap growth was often attributed to the Information Technology sector, this month it was Financials that drove the performance differential. Although the sector produced similar results in both indexes—a loss of 2.77% in the Russell 1000 Value Index versus a 2.70% decline in the Russell 1000 Growth Index—the weight of the sector was the key difference-maker: Financials were 21.41% of the value index compared with just 5.71% of the growth index.
Year to date, growth leads value by an average of 6.47% across the three Russell capitalization ranges. The major sector contributors to that outperformance varied by capitalization range, with information Technology leading in large caps, Health Care leading in mid caps, and Industrials leading in the small-cap space.
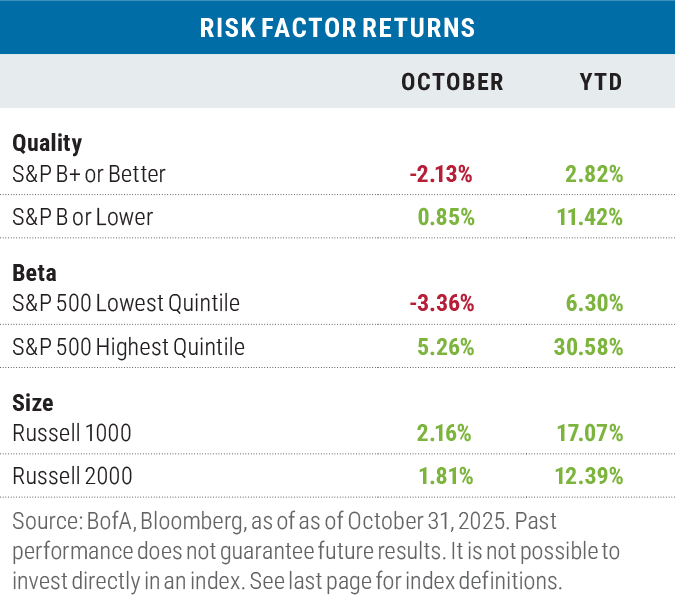
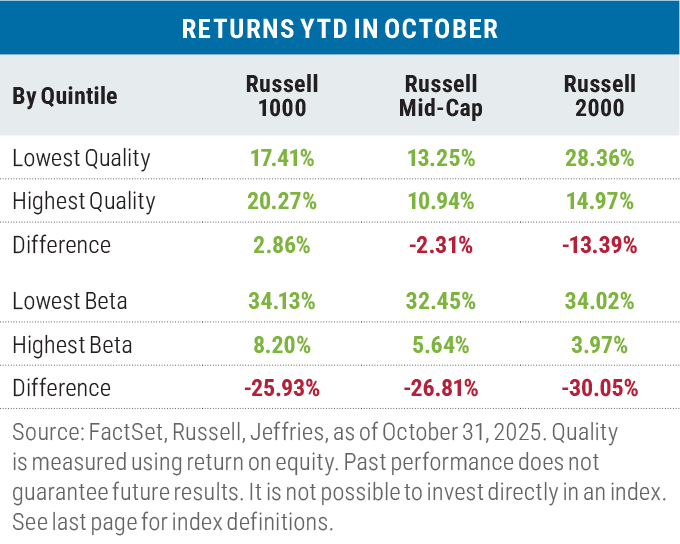
More “risk on” than “risk off” in October
The stock market rally continued to be dominated by low-quality, high-beta stocks, both for the month and for the year to date. Only the size factor has leaned towards risk off, but that has largely been due to the outsized performance of mega-cap tech stocks.
Across Russell indexes, the junkier and riskier, the better
Except for Russell 1000 Index, returns have favored the lowest quality stocks with the highest beta. But again, this is something of an anomaly since the high-quality segment of the Russell 1000 has lately been populated by mega-cap tech companies that are currently enjoying above average profitability—and stellar performance.
Looking overseas, in local currency terms both developed international and emerging market stocks outperformed the S&P 500 in October. Emerging market stocks also outperformed in U.S. dollar terms, as emerging market currencies posted only a slight decline relative to the $USD during the month. That was not the case for developed market stocks where a large gain for the Bloomberg DXY Dollar Index (which is measured against the 10 major U.S. trading partner currencies) pushed the return of the MSCI EAFE Index below the cap-weighted S&P 500 in U.S. dollar terms. (Note: The MSCI EM Currency Index measures emerging market currency performance versus the U.S. dollar, while the DXY measures the reverse—the USD versus major developed market currencies. A loss in the former and a gain in the latter both reflect a strengthening U.S. dollar.)
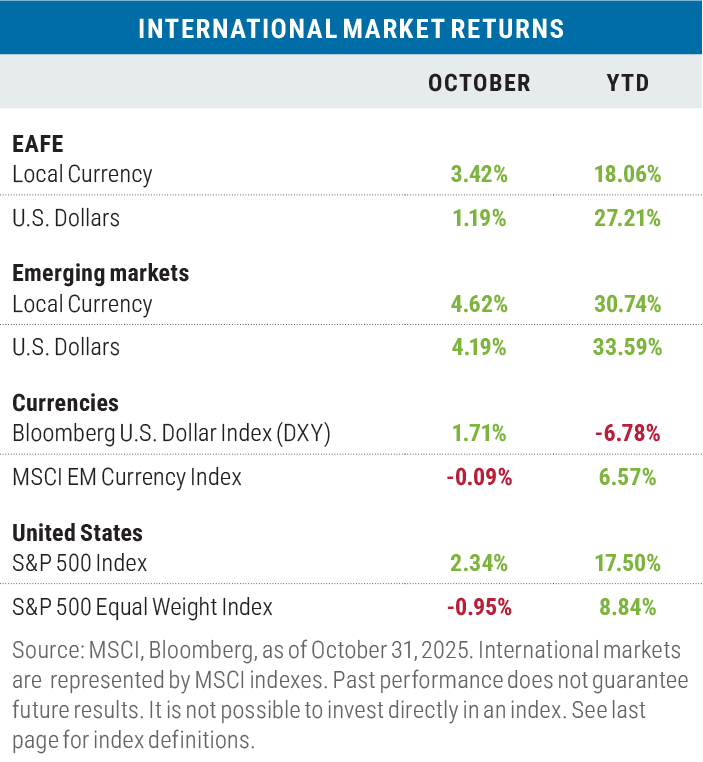
A 23.42% return for South Korea during the month gave a signifi cant boost to the overall returns for emerging markets; South Korea has the fourth-largest weight of any country in the MSCI Emerging Markets Index. Much of the gain was driven by the trade deal struck with the United States that puts a tariff cap of 15% on South Korean goods and car imports entering the U.S., which is down from 25% earlier this year.
Year to date both international markets have outperformed the S&P 500, in both local currency and U.S. dollar terms, a result of the significant valuation differences compared with U.S. equities and, subsequently, investors’ desire to diversify their holdings outside the U.S.
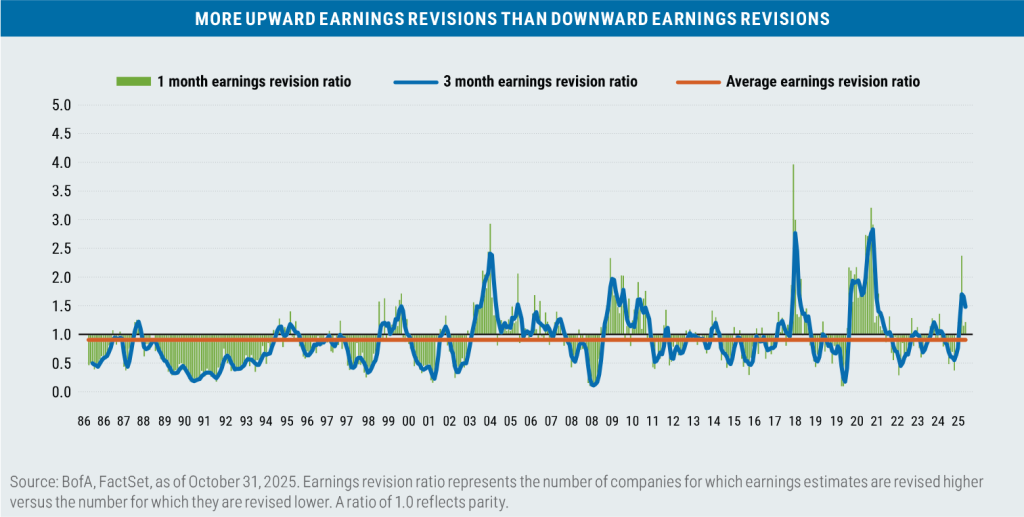
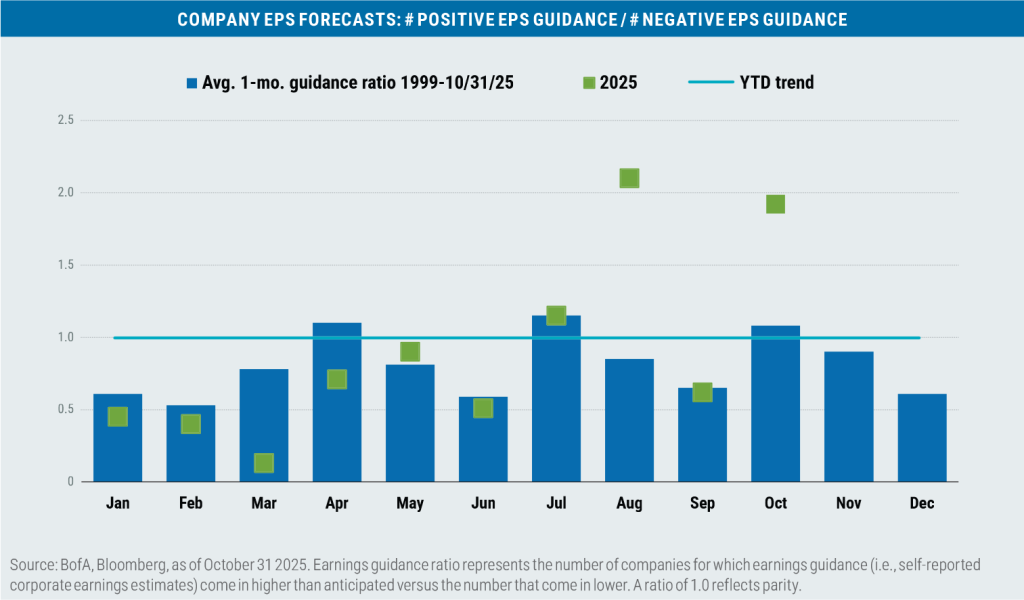
Earnings growth drove stock prices
Through October 31, 72% of the S&P 500 companies had reported earnings, resulting in a blended earnings-pershare (EPS) growth rate for the third quarter of +6.0% on a quarter-over-quarter basis and beating earnings expectations by an average of 10.5%. For context, this level of outperformance versus expectations was the tenth biggest going back to 1987.
On a year-over-year basis, earnings growth was 11.8%, marking the ninth consecutive quarter of positive year-over-year growth and the longest winning streak since 2019.
Ten of the eleven sectors of the S&P 500 have shown earnings growth year over year, with only Energy showing a decline of 3.7%. Should Energy wind up with positive EPS growth for the quarter (seven out of 22 companies had not yet reported as of month end), it would be the fi rst time since Q4 2021 that all eleven sectors posted positive quarterly EPS growth.
Looking ahead
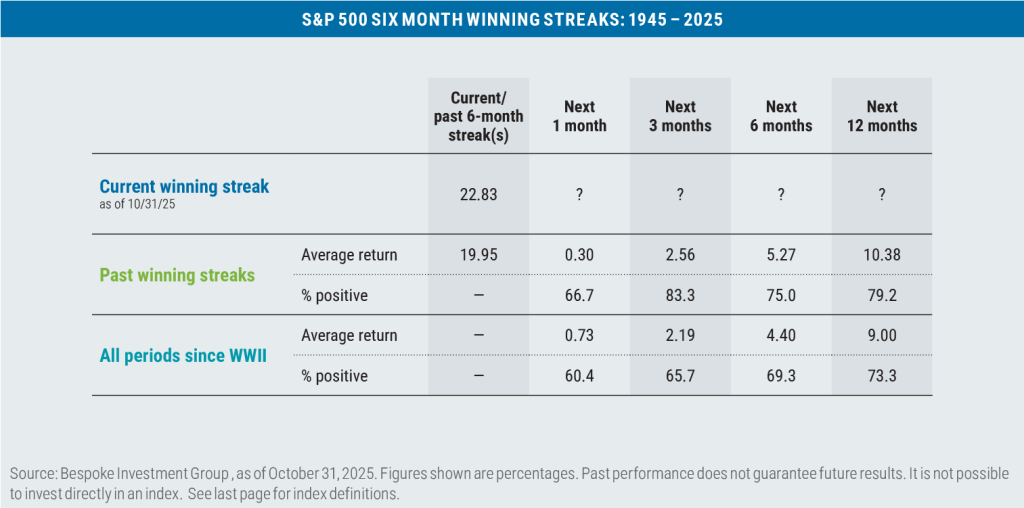
Since WWII, the S&P 500 has recorded six consecutive months of positive returns twenty-four times, and in all instances the index has gone on to produce better than average returns on a more consistent basis over the following three, six, and twelve months.
While the fundamental and technical backdrop for the S&P 500 remain positive, at least two conditions should warrant
some vigilance by investors:
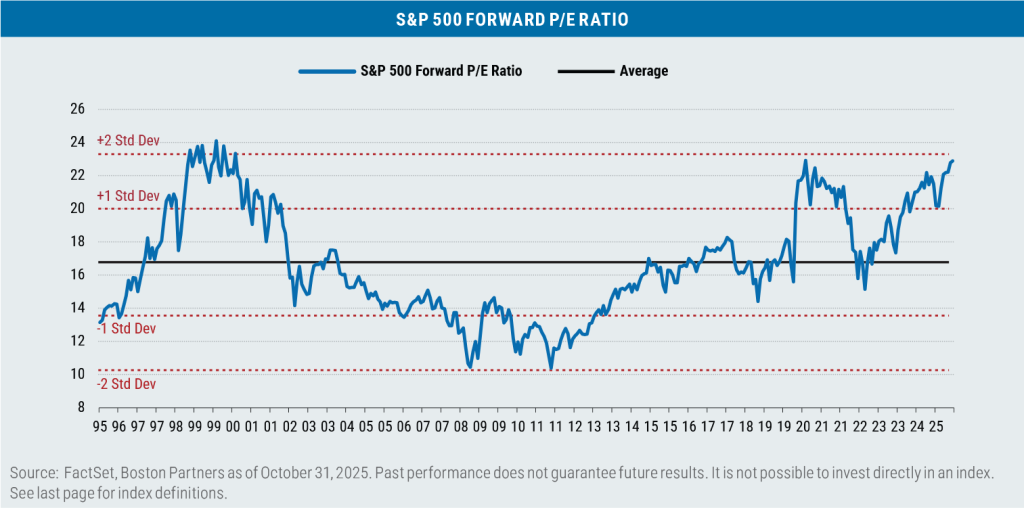
1) Valuations remains stretched
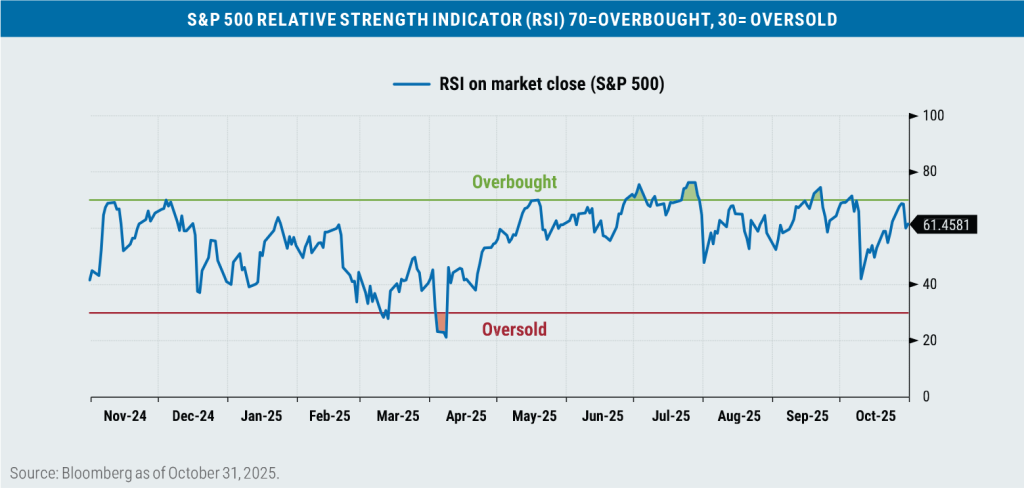
2) The index is more overbought than oversold
Bottom line: Proceed with caution.

Important disclosures
Boston Partners Global Investors, Inc. (“Boston Partners”) is an investment adviser registered with the SEC under the Investment Advisers Act of 1940. The views expressed in this commentary reflect those of the author as of the date of this commentary. Any such views are subject to change at any time based on market and other conditions and Boston Partners disclaims any responsibility to update such views. Past performance is not an indication of future results.
Discussions of securities, market returns, and trends are not intended to be a forecast of future events or returns. You should not assume that investments in the securities identified and discussed were or will be profitable.
Terms and definitions
Beta is a measure of a portfolio’s market risk relative to its benchmark. In general, a beta higher than 1.00 indicates a more volatile portfolio and beta lower than 1.00 indicates a less volatile portfolio in relation to its benchmark. The Bloomberg U.S. Aggregate Bond Index tracks the performance of intermediate-term investment-grade bonds traded in the United States. The Bloomberg U.S. Dollar Index (DXY) is used to measure the value of the dollar against a basket of six foreign currencies. The value of the index is a fair indication of the dollar’s value in global markets. Earnings per share (EPS) reflects a company’s total earnings divided by the total number of shares outstanding. Blended EPS combines historical (i.e., actual) earnings with earnings expectations and is often used to assess a group of companies that may be in different stages of their earnings reporting cycle. Forward P/E is a ratio that compares the current share price of a company to its estimated earnings per share over the next 12 months. The Magnificent Seven stocks are a group of high-performing and influential companies in the U.S. stock market: Alphabet, Amazon, Apple, Meta Platforms, Microsoft, NVIDIA, and Tesla. The MSCI Emerging Markets (EM) Currency Index tracks the performance of emerging market currencies relative to the U.S. dollar where the weight of each currency is equal to its country weight in the MSCI Emerging Markets Index. The MSCI EAFE Index tracks the performance of large- and mid-cap equities traded across global developed markets, excluding the United States and Canada. The MSCI Emerging Markets Index tracks the performance of large- and mid-cap equities traded in global emerging markets. Relative Strength Indicator (RSI) is a technical measure of the momentum of an index or security. It is designed to reflect the relative speed and intensity of price changes measured on a scale from 0 to 100. Return on equity (ROE) measures a company’s profitability by revealing how much profit a company generates with the money invested. The Russell 1000 Index tracks the performance of the 1,000 largest companies traded in the United States. The Russell 2000 Index tracks the performance of the 2,000 smallest companies traded in the United States. The Russell 1000 Growth and Value Indexes track the performance of those large-cap U.S. equities in the Russell 1000 Index with growth and value style characteristics, respectively. The Russell 2000 Growth and Value Indexes track the performance of those small-cap U.S. equities in the Russell 2000 Index with growth and value style characteristics, respectively. The Russell Midcap Growth and Value Indexes track the performance of those mid-cap U.S. companies in the Russell 1000 Index with growth and value style characteristics, respectively. The S&P 500 Index tracks the performance of the 500 largest companies traded in the United States. The S&P 500 Equal Weight Index also tracks the performance of the 500 largest companies traded in the United States, but weights each company equally, rather than proportionally according to market cap. S&P credit ratings, which range from AAA (highest) to D (default), are assigned by S&P Global to individual companies to indicate their relative creditworthiness. It is not possible to invest directly in an index.
Market capitalization breakpoints
The breakpoints for capitalization ranges should be viewed only as guideposts and will change over time. In general, FTSE Russell (which maintains a number of stock-market indexes based on company size) considers small-cap stocks to have market caps of between $150 million and $7 billion, mid caps to have market caps between $7 billion and $150 billion, and large caps to be those companies with market caps above $150 billion.
Boston Partners Global Investors, Inc. (Boston Partners) is composed of three divisions, Boston Partners, Boston Partners Private Wealth, and Weiss, Peck & Greer (WPG) Partners, and is an indirect, wholly owned subsidiary of ORIX Corporation of Japan (ORIX).
8587568.1