Mullaney on the Markets
Clear as mud
By Michael Mullaney | Director of Global Markets Research
Published June 2025
Additional temporary tariff reprieves from the Trump administration and a strong earnings season helped support equity returns during the month of May, leading the S&P 500 Index to post a 6.29% gain, the first positive monthly return for the index since January and its best monthly return since November 2023.
The bond market, on the other hand, was less enthusiastic about the House of Representatives’ passage of the 1,000+ page “One Big, Beautiful Bill,” which threatens to increase the federal budget deficit by upwards of $3 trillion over the next 10 years. Moody’s responded by downgrading the credit rating of the U.S. government from Aaa to Aa1 during the month, all of which led to higher yields and a 0.72% loss for the Bloomberg U.S. Aggregate Bond Index, its first monthly decline of the year.
The strength of May’s return for the S&P 500 helped to lift the benchmark into positive territory on a year-to-date basis with a gain of 1.06%, while the Bloomberg Aggregate index has so far returned 2.45%.
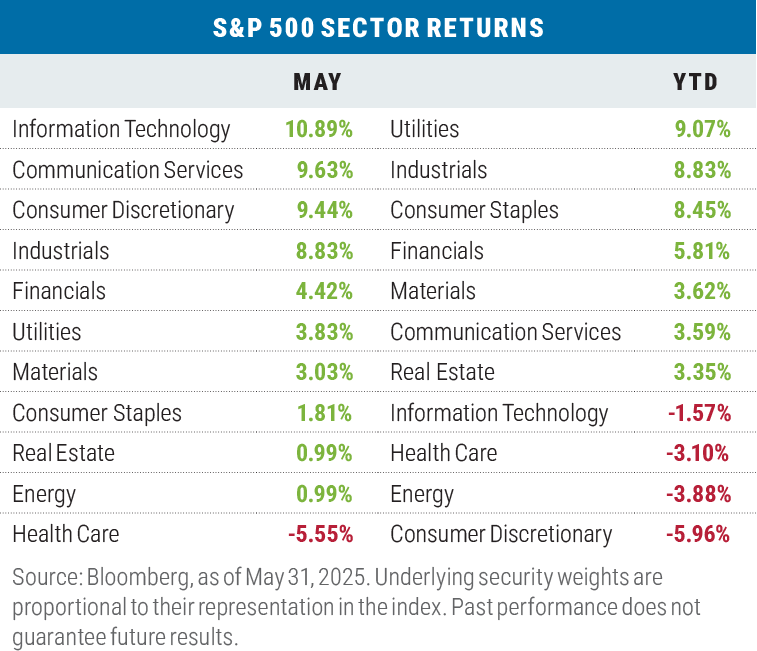
Sector leaders from 2024 led again in May
The Information Technology, Communication Services, and Consumer Discretionary sectors led all others during May with an average return of 9.99%, helped by the Magnificent Seven, which gained 13.36% for the month and represent a significant share of those three sectors.
Health Care was the lone laggard during the month as the Trump administration threatened the pharmaceutical industry with most-favored-nation drug pricing controls that could result in prices falling anywhere from 30% to 80% to match the costs of the same medications in other countries.
Year-to-date sector returns remain varied, with two defensive sectors (Utilities and Consumer Staples) and three cyclical sectors (Industrials, Financials, and Materials) at the top of the leaderboard. The aforementioned Health Care sector ranks poorly year to date as does Energy, which is suffering from weak oil prices triggered by the increase in oil production out of Saudi Arabia; the oil-rich nation has been attempting to squeeze out perceived serial production quota cheaters in the OPEC+. The Consumer Discretionary sector is pulling up the rear YTD; a 14.29% drop for Tesla accounted for nearly half of the sector’s underperformance relative to the overall index.
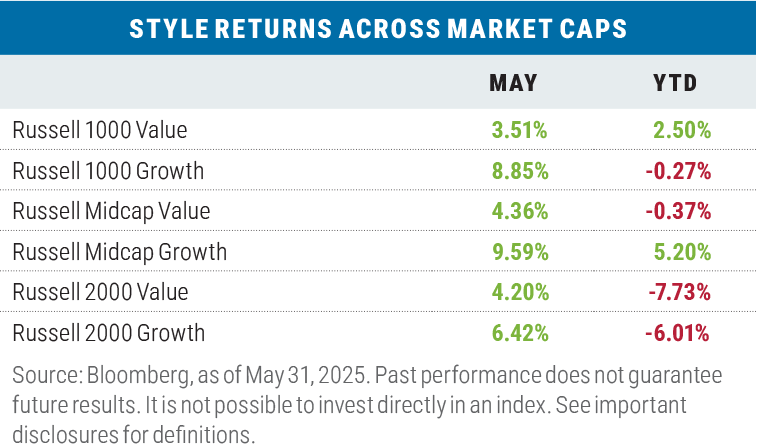
Growth maintained its lead for a second month
Growth beat value across all three Russell market capitalization ranges during the month with an average outperformance of 426 basis points across the three segments. The biggest differential was between the Russell 1000 Growth Index versus the Russell 1000 Value Index, which posted a 534 basis-point swing, with the Magnificent Seven responsible for roughly 68% of the outperformance.
Year to date, the Russell 1000 Value Index continued to outperform its growth counterpart by 277 basis points as of month end, but the other two market capitalization segments in value have now fallen behind growth; the biggest differential is in the mid-cap space, where growth leads value by 557 basis points. The Information Technology sector in mid-cap growth was responsible for approximately 74% of the index gain and 53% of the relative outperformance versus mid-cap value. A single stock, Palantir Technologies, has accounted for 81% of the overall outperformance of the Russell Mid-Cap Growth Index on the wings of its 74% gain so far this year.
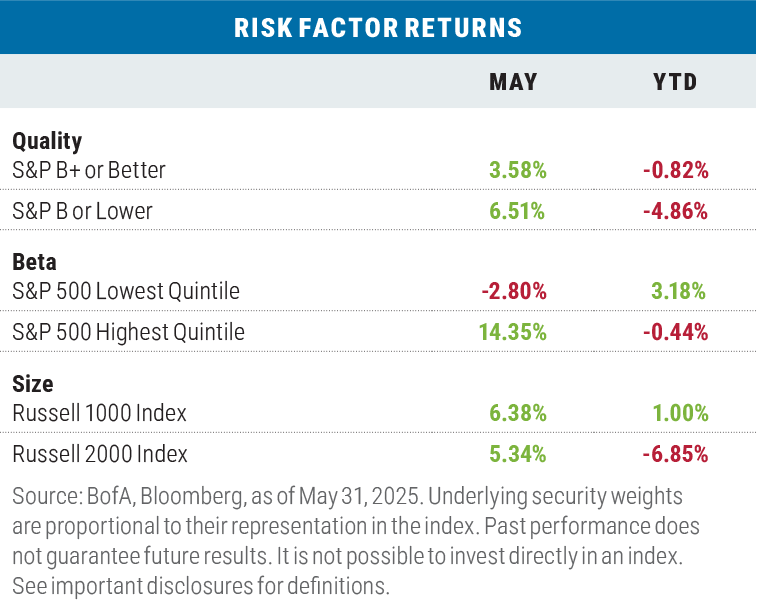
Risk-on trade dominated in May, but risk off still reigns YTD
In terms of quality, low-quality stocks led high quality during the month while high-beta names trounced their low-beta counterparts. Size-wise, large caps led riskier small caps, with mega-cap tech names dominating the performance landscape.
Over the year-to-date period, however, risk-off factors continued to lead in terms of quality, beta, and size metrics.
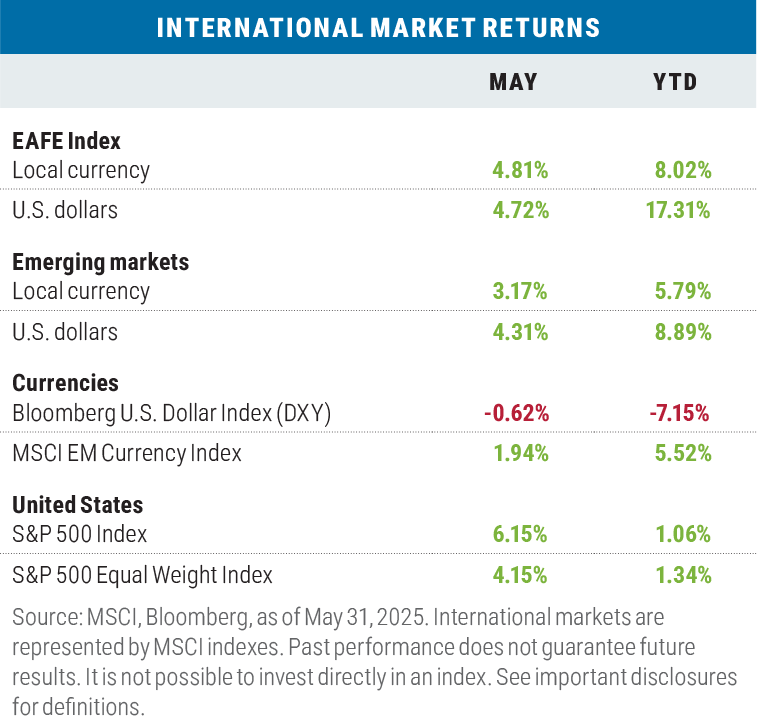
Non-U.S. stocks couldn’t catch the S&P 500 in May
The returns of both developed market and emerging market stocks, while positive, couldn’t keep pace with the surge of the S&P 500 in May.
Year-to-date, international stocks continued to maintain their lead over domestic stocks, particularly in U.S. dollar terms as the dollar has given up significant gains versus both developed and emerging market currencies; meanwhile, flows into non-U.S. assets have accelerated as the year has progressed.
Looking ahead
To say that the U.S. tariff situation remains fluid is a significant understatement. Beginning with “Liberation Day” on April 2, the administration has played a dizzying game of “tariff tether ball” that continued throughout May:
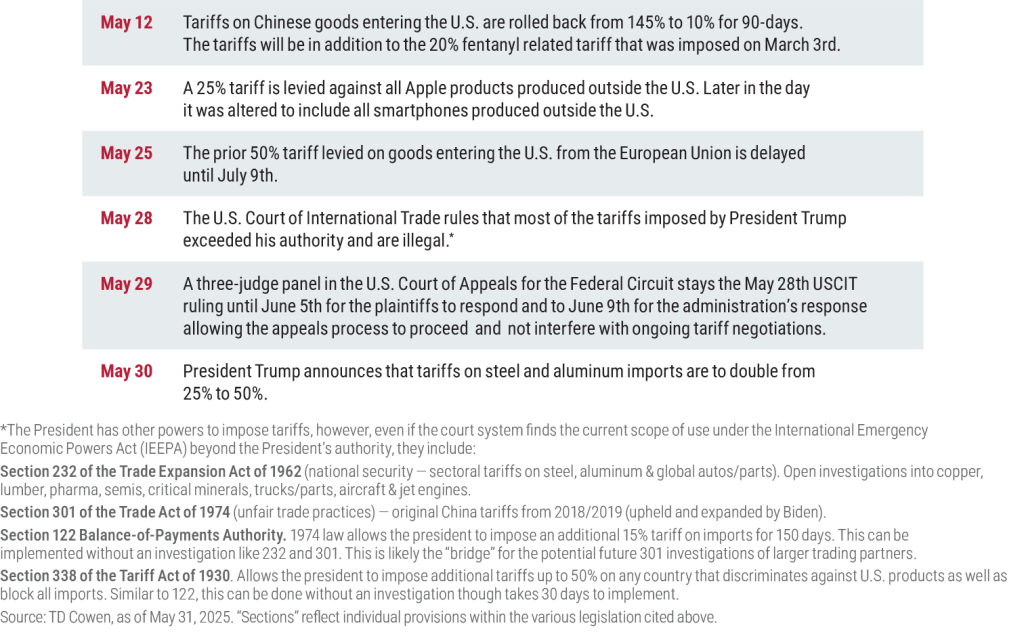
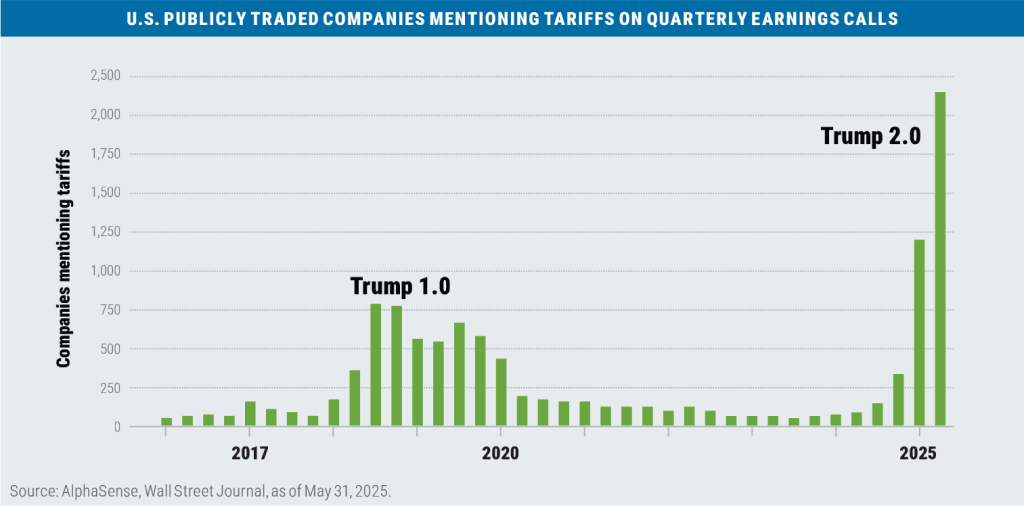
This tariff whiplash continued to confound U.S. corporations as they try and plan for capital spending initiatives, and the topic has skyrocketed on recent company earnings calls.
At what levels and to which countries and industries the tariffs will be applied remains a wild card and won’t be known until after July 9 when the 90-day moratorium on reciprocal tariffs announced on April 9 expires. The current thinking is that tariffs will wind up increasing by about 15% from current levels, which could bring in over $1.5 trillion dollars of revenue over the next decade as estimated by the Peterson Institute of International Economics.
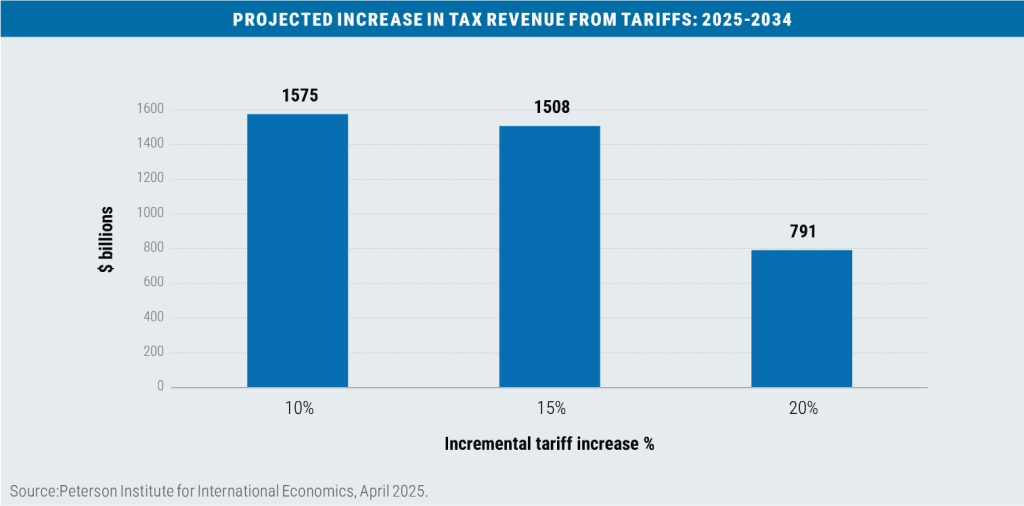
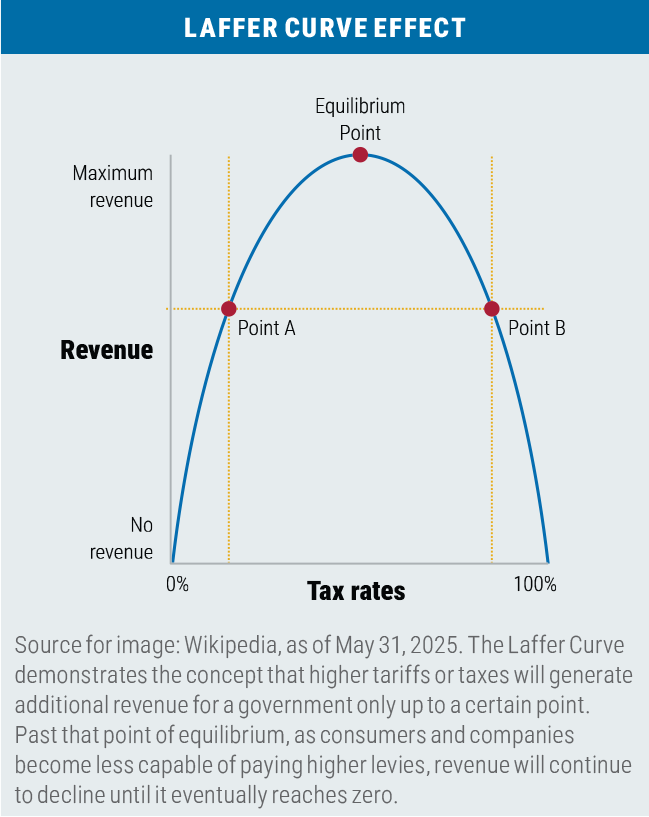
Note that these estimates are net of what is expected to be reciprocal retaliation by the exporting countries and the Laffer Curve effect, whereby excessive levels of tariffs (or taxes) impede consumption and act as a disincentive for investment expansion and consumption.
While $1.5 trillion in incremental revenue from tariffs over 10-years is a hefty number, it most likely will not cover the increase in spending in the current version of the reconciliation bill that has been proposed and passed by the U.S. House of Representatives. Most estimates point to a deficit increase of roughly $3 trillion over 10 years if key provisions of the 2017 Tax Cuts and Jobs Act (TCJA), including individual and business tax cuts, are extended or made permanent, let alone the new provisions eliminating taxes on tips and increasing state and local tax deductions (SALT) from $10,000 to $40,000.
Currently, the bill has been passed onto the U.S. Senate, where outlays and tax breaks will undergo further scrutiny before the bill is passed back to the House and then to the president for signing. President Trump has indicated that he wants the whole matter resolved and on his desk by July 4.
While the fiscal budget outlook looks daunting from a macroeconomic perspective and the tariff situation seems precarious from multiple standpoints, equity investors have remained largely complacent on the risks associated with both challenges and appear to be embracing a buy-the-dip mentality.
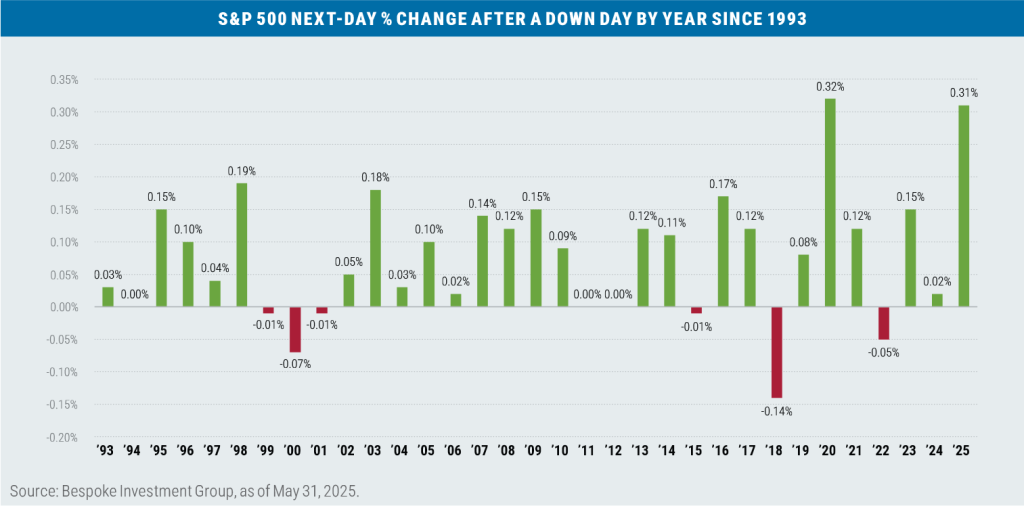
It will be interesting to see if this trading mentality holds up over the near term as the stock market enters the “sell in May and go away” seasonal period for returns. Time will tell!

Important disclosures
Boston Partners Global Investors, Inc. (“Boston Partners”) is an investment adviser composed of two divisions, Boston Partners and Weiss, Peck & Greer Partners (“WPG”), and is an indirect, wholly owned subsidiary of ORIX Corporation of Japan (“Orix”). Boston Partners is affiliated with listed corporations through common ownership. ORIX Corporation Europe, N.V. services may be offered in the U.S. through Robeco Institutional Asset Management, U.S.
Boston Partners Global Investors, Inc. (“Boston Partners”) is an investment adviser registered with the SEC under the Investment Advisers Act of 1940. The views expressed in this commentary reflect those of the author as of the date of this commentary. Any such views are subject to change at any time based on market and other conditions and Boston Partners disclaims any responsibility to update such views. Past performance is not an indication of future results.
Discussions of securities, market returns, and trends are not intended to be a forecast of future events or returns. You should not assume that investments in the securities identified and discussed were or will be profitable.
Terms and definitions
Beta is a measure of a portfolio’s market risk relative to its benchmark. In general, a beta higher than 1.00 indicates a more volatile portfolio and beta lower than 1.00 indicates a less volatile portfolio in relation to its benchmark. The Bloomberg U.S. Aggregate Bond Index tracks the performance of intermediate-term investment-grade bonds traded in the United States. The Bloomberg U.S. Dollar Index (DXY) is used to measure the value of the dollar against a basket of six foreign currencies. The value of the index is a fair indication of the dollar’s value in global markets. The Magnificent Seven stocks are a group of high-performing and influential companies in the U.S. stock market: Alphabet, Amazon, Apple, Meta Platforms, Microsoft, NVIDIA, and Tesla. Moody’s credit rating system ranks the creditworthiness of bond issuers, from Aaa to Aa, A, Baa, and so on through C. Numerical modifiers indicate how high or low in a particular tier an issuer ranks, with 1 being the highest and 3 the lowest. The MSCI Emerging Markets (EM) Currency Index tracks the performance of emerging market currencies relative to the U.S. dollar where the weight of each currency is equal to its country weight in the MSCI Emerging Markets Index. The MSCI EAFE Index tracks the performance of large- and mid-cap equities traded across global developed markets, excluding the United States and Canada. The MSCI Emerging Markets Index tracks the performance of large- and mid-cap equities traded in global emerging markets. The Organization of the Petroleum Exporting Countries (OPEC) is an alliance of 12 oil-producing and exporting countries designed to influence the global supply of petroleum and maximize profits. The plus designation includes an additional 10 countries that also follow OPEC policies. The Russell 1000 Index tracks the performance of the 1,000 largest companies traded in the United States. The Russell 2000 Index tracks the performance of the 2,000 smallest companies traded in the United States. The Russell 1000 Growth and Value Indexes track the performance of those large-cap U.S. equities in the Russell 1000 Index with growth and value style characteristics, respectively. The Russell 2000 Growth and Value Indexes track the performance of those small-cap U.S. equities in the Russell 2000 Index with growth and value style characteristics, respectively. The Russell Midcap Growth and Value Indexes track the performance of those mid-cap U.S. companies in the Russell 1000 Index with growth and value style characteristics, respectively. The S&P 500 Index tracks the performance of the 500 largest companies traded in the United States. The S&P 500 Equal Weight Index also tracks the performance of the 500 largest companies traded in the United States, but weights each company equally, rather than proportionally according to market cap. S&P credit ratings, which range from AAA (highest) to D (default), are assigned by S&P Global to individual companies to indicate their relative creditworthiness. It is not possible to invest directly in an index.
8039953.1